HSBC 2012 Annual Report Download - page 54
Download and view the complete annual report
Please find page 54 of the 2012 HSBC annual report below. You can navigate through the pages in the report by either clicking on the pages listed below, or by using the keyword search tool below to find specific information within the annual report.-
 1
1 -
2
-
3
-
4
-
5
-
6
-
7
-
8
-
9
-
10
-
11
-
12
-
13
-
14
-
15
-
16
-
17
-
18
-
19
-
20
-
21
-
22
-
23
-
24
-
25
-
26
-
27
-
28
-
29
-
30
-
31
-
32
-
33
-
34
-
35
-
36
-
37
-
38
-
39
-
40
-
41
-
42
-
43
-
 44
44 -
 45
45 -
 46
46 -
 47
47 -
 48
48 -
 49
49 -
 50
50 -
 51
51 -
 52
52 -
 53
53 -
 54
54 -
 55
55 -
 56
56 -
 57
57 -
 58
58 -
 59
59 -
 60
60 -
 61
61 -
 62
62 -
 63
63 -
 64
64 -
65
-
66
-
67
-
68
-
69
-
70
-
71
-
72
-
73
-
74
-
75
-
76
-
77
-
78
-
79
-
80
-
81
-
82
-
83
-
84
-
85
-
86
-
87
-
88
-
89
-
90
-
91
-
92
-
93
-
94
-
95
-
96
-
97
-
98
-
99
-
100
-
101
-
102
-
103
-
104
-
105
-
106
-
107
-
108
-
109
-
110
-
111
-
112
-
113
-
114
-
115
-
116
-
117
-
118
-
119
-
120
-
121
-
122
-
123
-
124
-
125
-
126
-
127
-
128
-
129
-
130
-
131
-
132
-
133
-
134
-
135
-
136
-
137
-
138
-
139
-
140
-
141
-
142
-
143
-
144
-
145
-
146
-
147
-
148
-
149
-
150
-
151
-
152
-
153
-
154
-
155
-
156
-
157
-
158
-
159
-
160
-
161
-
162
-
163
-
164
-
165
-
166
-
167
-
168
-
169
-
170
-
171
-
172
-
173
-
174
-
175
-
176
-
177
-
178
-
179
-
180
-
181
-
182
-
183
-
184
-
185
-
186
-
187
-
188
-
189
-
190
-
191
-
192
-
193
-
194
-
195
-
196
-
197
-
198
-
199
-
200
-
201
-
202
-
203
-
204
-
205
-
206
-
207
-
208
-
209
-
210
-
211
-
212
-
213
-
214
-
215
-
216
-
217
-
218
-
219
-
220
-
221
-
222
-
223
-
224
-
225
-
226
-
227
-
228
-
229
-
230
-
231
-
232
-
233
-
234
-
235
-
236
-
237
-
238
-
239
-
240
-
241
-
242
-
243
-
244
-
245
-
246
-
247
-
248
-
249
-
250
-
251
-
252
-
253
-
254
-
255
-
256
-
257
-
258
-
259
-
260
-
261
-
262
-
263
-
264
-
265
-
266
-
267
-
268
-
269
-
270
-
271
-
272
-
273
-
274
-
275
-
276
-
277
-
278
-
279
-
280
-
281
-
282
-
283
-
284
-
285
-
286
-
287
-
288
-
289
-
290
-
291
-
292
-
293
-
294
-
295
-
296
-
297
-
298
-
299
-
300
-
301
-
302
-
303
-
304
-
305
-
306
-
307
-
308
-
309
-
310
-
311
-
312
-
313
-
314
-
315
-
316
-
317
-
318
-
319
-
320
-
321
-
322
-
323
-
324
-
325
-
326
-
327
-
328
-
329
-
330
-
331
-
332
-
333
-
334
-
335
-
336
-
337
-
338
-
339
-
340
-
341
-
342
-
343
-
344
-
345
-
346
-
347
-
348
-
349
-
350
-
351
-
352
-
353
-
354
-
355
-
356
-
357
-
358
-
359
-
360
-
361
-
362
-
363
-
364
-
365
-
366
-
367
-
368
-
369
-
370
-
371
-
372
-
373
-
374
-
375
-
376
-
377
-
378
-
379
-
380
-
381
-
382
-
383
-
384
-
385
-
386
-
387
-
388
-
389
-
390
-
391
-
392
-
393
-
394
-
395
-
396
-
397
-
398
-
399
-
400
-
401
-
402
-
403
-
404
-
405
-
406
-
407
-
408
-
409
-
410
-
411
-
412
-
413
-
414
-
415
-
416
-
417
-
418
-
419
-
420
-
421
-
422
-
423
-
424
-
425
-
426
-
427
-
428
-
429
-
430
-
431
-
432
-
433
-
434
-
435
-
436
-
437
-
438
-
439
-
440
-
441
-
442
-
443
-
444
-
445
-
446
-
447
-
448
-
449
-
450
-
451
-
452
-
453
-
454
-
455
-
456
-
457
-
458
-
459
-
460
-
461
-
462
-
463
-
464
-
465
-
466
-
467
-
468
-
469
-
470
-
471
-
472
-
473
-
474
-
475
-
476
-
477
-
478
-
479
-
480
-
481
-
482
-
483
-
484
-
485
-
486
-
487
-
488
-
489
-
490
-
491
-
492
-
493
-
494
-
495
-
496
-
497
-
498
-
499
-
500
-
501
-
502
-
503
-
504
-
505
-
506
-
507
-
508
-
509
-
510
-
511
-
512
-
513
-
514
-
515
-
516
-
517
-
518
-
519
-
520
-
521
-
522
-
523
-
524
-
525
-
526
-
527
-
528
-
529
-
530
-
531
-
532
-
533
-
534
-
535
-
536
-
537
-
538
-
539
-
540
-
541
-
542
-
543
-
544
-
545
-
546
 |
 |

HSBC HOLDINGS PLC
Report of the Directors: Operating and Financial Review (continued)
Financial summary > Reconciliation of RoRWA measures / Disposals, held for sale and run-off portfolios
52
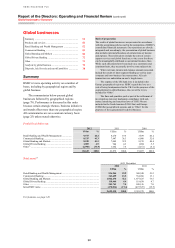
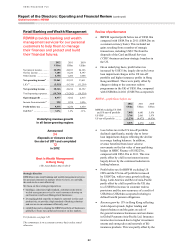
Reconciliation of RoRWA measures
Performance Management
We target a return on average ordinary shareholders’ equity of
12%–15%. For internal management purposes we monitor
global businesses and geographical regions by pre-tax return
on RWAs, a metric which combines return on equity and
regulatory capital efficiency objectives.
In addition to measuring return on average risk-
weighted assets (‘RoRWA’) we measure our
performance internally using the non-GAAP
measure of underlying RoRWA, which is underlying
profit before tax as a percentage of average risk-
weighted assets adjusted for the effects of foreign
currency translation differences and business
disposals. Underlying RoRWA adjusts performance
for certain items which distort year-on-year
performance as explained on page 26.
We also present the non-GAAP measure of
underlying RoRWA adjusted for the effect of
operations which are not regarded as contributing to
the longer-term performance of the Group. These
include the run-off portfolios and the Card and Retail
Services business which was sold in 2012.
The Card and Retail Services average RWAs in
the table below represent the average of the
associated operational risk RWAs that were not
immediately released on disposal and have not
already been adjusted as part of the underlying
RoRWA calculation. The pre-tax loss for Card and
Retail Services in the table below primarily relates to
litigation expenses incurred after the sale of the
business that have not been adjusted as part of the
underlying RoRWA calculation.
Reconciliation of underlying RoRWA (excluding run-off portfolios and Card and Retail Services)
2012 2011
Pre-tax
return
Average
RWAs66
RoRWA
66,67
Pre-tax
return
Average
RWAs66
RoRWA
66,67
US$m US$bn % US$m US$bn %
Reported ........................................................... 20,649 1,172 1.8 21,872 1,154 1.9
Underlying67 ..................................................... 16,385 1,129 1.5 13,861 1,077 1.3
Run-off portfolios ............................................ (1,630) 167 (1.0) (4,901) 169 (2.9)
Legacy credit in GB&M .............................. (280) 45 (0.6) (429) 33 (1.3)
US CML and other68 .................................... (1,350) 122 (1.1) (4,472) 136 (3.3)
Card and Retail Services ................................. (150) 5 (3.0) – – –
Underlying (excluding run-off portfolios
and Card and Retail Services) ..................... 18,165 957 1.9 18,762 908 2.1
For footnotes, see page 120.
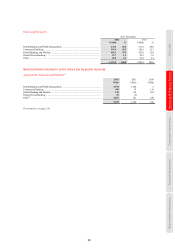
Reconciliation of reported and underlying average risk-weighted assets
Year ended 31 December
2012 2011 Change
US$bn US$bn %
Average reported RWAs66 .......................................................................................... 1,172 1,154 2
Currency translation adjustment24 .............................................................................. – (7)
Acquisitions, disposals and dilutions ................................................................................ (43) (70)
Average underlying RWAs66 ...................................................................................... 1,129 1,077 5
Disposals, held for sale and run-off
portfolios
In implementing our strategy, we have sold or
agreed to sell a number of businesses and
investments across the Group. The sale of these
businesses and investments will have a significant
effect on both our revenue and profitability in the
future. In addition, we have substantial portfolios
which are being run down. We expect the losses on
these portfolios to continue to affect the Group in the
future.
The table below presents the contribution of
these businesses and investments to the historical
results of the Group. We do not expect the historical
results to be indicative of future results because of
disposals or run-offs. Fixed allocated costs, included
in total operating costs, will not necessarily be
removed upon disposal and have been separately
identified.