HSBC 2012 Annual Report Download - page 70
Download and view the complete annual report
Please find page 70 of the 2012 HSBC annual report below. You can navigate through the pages in the report by either clicking on the pages listed below, or by using the keyword search tool below to find specific information within the annual report.-
 1
1 -
2
-
3
-
4
-
5
-
6
-
7
-
8
-
9
-
10
-
11
-
12
-
13
-
14
-
15
-
16
-
17
-
18
-
19
-
20
-
21
-
22
-
23
-
24
-
25
-
26
-
27
-
28
-
29
-
30
-
31
-
32
-
33
-
34
-
35
-
36
-
37
-
38
-
39
-
40
-
41
-
42
-
43
-
44
-
45
-
46
-
47
-
48
-
49
-
50
-
51
-
52
-
53
-
54
-
55
-
56
-
57
-
58
-
59
-
 60
60 -
 61
61 -
 62
62 -
 63
63 -
 64
64 -
 65
65 -
 66
66 -
 67
67 -
 68
68 -
 69
69 -
 70
70 -
 71
71 -
 72
72 -
 73
73 -
 74
74 -
 75
75 -
 76
76 -
 77
77 -
 78
78 -
 79
79 -
 80
80 -
81
-
82
-
83
-
84
-
85
-
86
-
87
-
88
-
89
-
90
-
91
-
92
-
93
-
94
-
95
-
96
-
97
-
98
-
99
-
100
-
101
-
102
-
103
-
104
-
105
-
106
-
107
-
108
-
109
-
110
-
111
-
112
-
113
-
114
-
115
-
116
-
117
-
118
-
119
-
120
-
121
-
122
-
123
-
124
-
125
-
126
-
127
-
128
-
129
-
130
-
131
-
132
-
133
-
134
-
135
-
136
-
137
-
138
-
139
-
140
-
141
-
142
-
143
-
144
-
145
-
146
-
147
-
148
-
149
-
150
-
151
-
152
-
153
-
154
-
155
-
156
-
157
-
158
-
159
-
160
-
161
-
162
-
163
-
164
-
165
-
166
-
167
-
168
-
169
-
170
-
171
-
172
-
173
-
174
-
175
-
176
-
177
-
178
-
179
-
180
-
181
-
182
-
183
-
184
-
185
-
186
-
187
-
188
-
189
-
190
-
191
-
192
-
193
-
194
-
195
-
196
-
197
-
198
-
199
-
200
-
201
-
202
-
203
-
204
-
205
-
206
-
207
-
208
-
209
-
210
-
211
-
212
-
213
-
214
-
215
-
216
-
217
-
218
-
219
-
220
-
221
-
222
-
223
-
224
-
225
-
226
-
227
-
228
-
229
-
230
-
231
-
232
-
233
-
234
-
235
-
236
-
237
-
238
-
239
-
240
-
241
-
242
-
243
-
244
-
245
-
246
-
247
-
248
-
249
-
250
-
251
-
252
-
253
-
254
-
255
-
256
-
257
-
258
-
259
-
260
-
261
-
262
-
263
-
264
-
265
-
266
-
267
-
268
-
269
-
270
-
271
-
272
-
273
-
274
-
275
-
276
-
277
-
278
-
279
-
280
-
281
-
282
-
283
-
284
-
285
-
286
-
287
-
288
-
289
-
290
-
291
-
292
-
293
-
294
-
295
-
296
-
297
-
298
-
299
-
300
-
301
-
302
-
303
-
304
-
305
-
306
-
307
-
308
-
309
-
310
-
311
-
312
-
313
-
314
-
315
-
316
-
317
-
318
-
319
-
320
-
321
-
322
-
323
-
324
-
325
-
326
-
327
-
328
-
329
-
330
-
331
-
332
-
333
-
334
-
335
-
336
-
337
-
338
-
339
-
340
-
341
-
342
-
343
-
344
-
345
-
346
-
347
-
348
-
349
-
350
-
351
-
352
-
353
-
354
-
355
-
356
-
357
-
358
-
359
-
360
-
361
-
362
-
363
-
364
-
365
-
366
-
367
-
368
-
369
-
370
-
371
-
372
-
373
-
374
-
375
-
376
-
377
-
378
-
379
-
380
-
381
-
382
-
383
-
384
-
385
-
386
-
387
-
388
-
389
-
390
-
391
-
392
-
393
-
394
-
395
-
396
-
397
-
398
-
399
-
400
-
401
-
402
-
403
-
404
-
405
-
406
-
407
-
408
-
409
-
410
-
411
-
412
-
413
-
414
-
415
-
416
-
417
-
418
-
419
-
420
-
421
-
422
-
423
-
424
-
425
-
426
-
427
-
428
-
429
-
430
-
431
-
432
-
433
-
434
-
435
-
436
-
437
-
438
-
439
-
440
-
441
-
442
-
443
-
444
-
445
-
446
-
447
-
448
-
449
-
450
-
451
-
452
-
453
-
454
-
455
-
456
-
457
-
458
-
459
-
460
-
461
-
462
-
463
-
464
-
465
-
466
-
467
-
468
-
469
-
470
-
471
-
472
-
473
-
474
-
475
-
476
-
477
-
478
-
479
-
480
-
481
-
482
-
483
-
484
-
485
-
486
-
487
-
488
-
489
-
490
-
491
-
492
-
493
-
494
-
495
-
496
-
497
-
498
-
499
-
500
-
501
-
502
-
503
-
504
-
505
-
506
-
507
-
508
-
509
-
510
-
511
-
512
-
513
-
514
-
515
-
516
-
517
-
518
-
519
-
520
-
521
-
522
-
523
-
524
-
525
-
526
-
527
-
528
-
529
-
530
-
531
-
532
-
533
-
534
-
535
-
536
-
537
-
538
-
539
-
540
-
541
-
542
-
543
-
544
-
545
-
546
 |
 |

HSBC HOLDINGS PLC
Report of the Directors: Operating and Financial Review (continued)
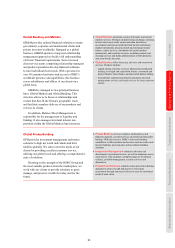
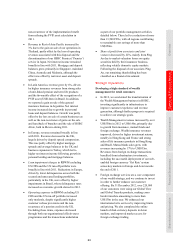
Global businesses > GB&M
68
Global Banking and Markets
GB&M provides tailored financial
solutions to major government,
corporate and institutional clients
worldwide.
2012 2011 2010
US$m US$m US$m
Net interest income .......... 6,960 7,263 7,343
Net fee income ................. 3,329 3,227 3,664
Net trading income78 ........ 5,690 5,204 5,830
Other income .................... 2,294 1,363 2,075
Net operating income21 .. 18,273 17,057 18,912
LICs76 ............................... (670) (984) (990)
Net operating income .... 17,603 16,073 17,922
Total operating expenses .. (9,907) (9,722) (9,228)
Operating profit ............. 7,696 6,351 8,694
Income from associates77 ... 824 698 521
Profit before tax ............. 8,520 7,049 9,215
RoRWA66 ......................... 2.1% 1.8% 2.5%
Record reported revenues from
corporate and institutional
debt issuance
77%
of profit before tax
from faster-growing regions
Most Innovative
Investment Bank of the Year
(The Banker Investment Banking Awards 2012)
Strategic direction
GB&M continues to pursue its well-established ‘emerging
markets-led and financing-focused’ strategy, with the objective of
being a leading international wholesale bank. This strategy has
evolved to include a greater emphasis on connectivity between the
global businesses, across the regions and within GB&M,
leveraging the Group’s extensive distribution network.
We focus on four strategic imperatives:
• reinforce client coverage and client-led solutions for major
government, corporate and institutional clients;
• continue to selectively invest in the business to support the
delivery of an integrated suite of products and services;
• enhance collaboration with other global businesses, particularly
CMB, to appropriately service the needs of our international
client base; and
• focus on business re-engineering to optimise operational
efficiency and reduce costs.
For footnotes, see page 120.
The commentary is on a constant currency basis unless stated
otherwise.
Review of performance
• GB&M reported profit before tax of US$8.5bn,
21% higher than in 2011. On a constant
currency basis, profit before tax increased by
24% despite a significant net charge relating
to credit and debit derivative valuation
adjustments. The rise in profit before tax was
driven by strong revenue growth, notably in
Rates and Credit, together with significantly
lower credit risk provisions than in 2011, partly
offset by higher operating expenses. GB&M is
well positioned for growth in faster-growing
regions with record reported revenues in Hong
Kong (US$2.8bn), Rest of Asia-Pacific
(US$4.0bn) and Latin America (US$1.8bn).
• In the fourth quarter a net charge of US$385m
was reported in net trading income as a result of
a change in estimation methodology in respect
of credit valuation adjustments on derivative
assets of US$903m and debit valuation
adjustments on derivative liabilities of
US$518m to reflect evolving market practices
(see Note 15 on the Financial Statements).
• Notwithstanding the charge noted above,
revenues rose by 10%, primarily due to
significantly higher trading revenues in
Rates and Credit, notably in Europe, as spreads
tightened and investor sentiment improved
following stimuli by central banks globally.
Balance Sheet Management reported higher
gains on the disposal of available-for-sale debt
securities, largely in the UK, while Payments
and Cash Management benefited from growth in
average liability balances, increased transaction
volumes and new mandates. These increases
were partly offset by a fall in revenues from our
Equities business due to lower client activity
as market volumes declined. Revenues in 2012
also included adverse fair value movements
from own credit spreads on structured liabilities
of US$629m compared with a favourable fair
value movement of US$458m reported in 2011.
• Loan impairment charges and other credit risk
provisions decreased by US$300m compared
with 2011. Credit risk provisions declined
significantly, from US$515m in 2011 to
US$117m in 2012, driven by lower impairment
charges on Greek sovereign debt, and on
available-for-sale ABSs in our legacy portfolio
reflecting an improvement in underlying asset
prices. This was partly offset by a US$97m
increase in loan impairment charges as a result
of a small number of specific impairments in