McDonalds 2002 Annual Report Download - page 2
Download and view the complete annual report
Please find page 2 of the 2002 McDonalds annual report below. You can navigate through the pages in the report by either clicking on the pages listed below, or by using the keyword search tool below to find specific information within the annual report.-
 1
1 -
 2
2 -
 3
3 -
 4
4 -
 5
5 -
 6
6 -
 7
7 -
 8
8 -
 9
9 -
 10
10 -
 11
11 -
 12
12 -
 13
13 -
14
-
15
-
16
-
17
-
18
-
19
-
20
-
21
-
22
-
23
-
24
-
25
-
26
-
27
-
28
-
29
-
30
-
31
-
32
-
33
 |
 |

Contents
1
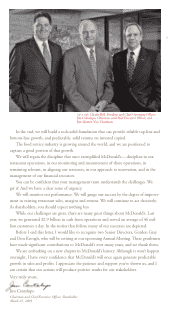
Letter to shareholders
4
McDonald’s means business
14
Management speaks out
28
To dance on dreams
31
Directors and corporate officers
32
Investor information and services
(1) Includes pretax operating charges of $853 million ($700 million after tax or $0.55 per
share) primarily related to restructuring markets and eliminating positions, restaurant
closings/asset impairment and the write-off of technology costs. (The cash portion of
this pretax expense was approximately $100 million after tax.)
(2) Includes $378 million of pretax operating charges primarily related to the U.S.
business reorganization and other global change initiatives, and restaurant closing/asset
impairment charges.
(3) Includes pretax operating charges of $322 million ($219 million after tax or $0.16 per
share) consisting of $162 million of Made For You costs and the $160 million charge
related to the home office productivity initiative.
(4) Includes a net pretax expense of $253 million ($143 million after tax or $0.11 per
share) consisting of $378 million of pretax operating charges noted in (2) above and
$125 million of net pretax nonoperating income primarily related to a gain on the initial
public offering of McDonald’s Japan. (The cash portion of this net pretax expense was
approximately $100 million after tax.) Net income also reflects an effective tax rate of
29.8 percent, primarily due to the benefit of tax law changes in certain international
markets ($147 million).
(5) In 2002, includes a $98.6 million after-tax charge ($0.08 per share–basic and $0.07
per share–diluted) to reflect the cumulative effect of the adoption of SFAS No. 142,
Goodwill and Other Intangible Assets, which eliminates the amortization of goodwill and
instead subjects it to annual impairment tests. Net income per share, adjusted for the
nonamortization provisions of SFAS No. 142, would have been $0.02 higher than the
amount reported for 2001 and 2000 and $0.01 higher for 1996–1999.
(6) Systemwide sales include sales by all restaurants, whether operated by the
Company, by franchisees or by affiliates operating under joint-venture agreements.
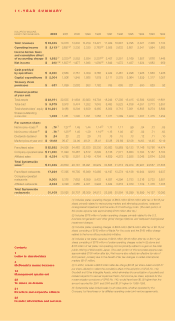
DOLLARS IN MILLIONS,
EXCEPT PER SHARE DATA
2002 2001 2000 1999 1998 1997 1996 1995 1994 1993 1992
Total revenues $ 15,406 14,870 14,243 13,259 12,421 11,409 10,687 9,795 8,321 7,408 7,133
Operating income $ 2,113
(1)
2,697
(2)
3,330 3,320 2,762
(3)
2,808 2,633 2,601 2,241 1,984 1,862
Income before taxes
and cumulative effect
of accounting change $ 1,662
(1)
2,330
(4)
2,882 2,884 2,307
(3)
2,407 2,251 2,169 1,887 1,676 1,448
Net income $ 893
(1,5)
1,637
(4)
1,977 1,948 1,550
(3)
1,642 1,573 1,427 1,224 1,083 959
Cash provided
by operations $ 2,890 2,688 2,751 3,009 2,766 2,442 2,461 2,296 1,926 1,680 1,426
Capital expenditures $ 2,004 1,906 1,945 1,868 1,879 2,111 2,375 2,064 1,539 1,317 1,087
Treasury stock
purchases $ 687 1,090 2,002 933 1,162 765 605 321 500 628 92
Financial position
at year end:
Total assets $23,971 22,535 21,684 20,983 19,784 18,242 17,386 15,415 13,592 12,035 11,681
Total debt $9,979 8,918 8,474 7,252 7,043 6,463 5,523 4,836 4,351 3,713 3,857
Total shareholders’ equity $10,281 9,488 9,204 9,639 9,465 8,852 8,718 7,861 6,885 6,274 5,892
Shares outstanding
IN MILLIONS
1,268 1,281 1,305 1,351 1,356 1,371 1,389 1,400 1,387 1,415 1,454
Per common share:
Net income–basic
(5)
$.70
(1)
1.27
(4)
1.49 1.44 1.14
(3)
1.17 1.11 .99 .84 .73 .65
Net income–diluted
(5)
$.70
(1)
1.25
(4)
1.46 1.39 1.10
(3)
1.15 1.08 .97 .82 .71 .63
Dividends declared $.24 .23 .22 .20 .18 .16 .15 .13 .12 .11 .10
Market price at year end $16.08 26.47 34.00 40.31 38.41 23.88 22.69 22.56 14.63 14.25 12.19
Franchised sales $25,692 24,838 24,463 23,830 22,330 20,863 19,969 19,123 17,146 15,756 14,474
Company-operated sales $11,500 11,040 10,467 9,512 8,895 8,136 7,571 6,863 5,793 5,157 5,103
Affiliated sales $4,334 4,752 5,251 5,149 4,754 4,639 4,272 3,928 3,048 2,674 2,308
Total Systemwide
sales
(6)
$41,526 40,630 40,181 38,491 35,979 33,638 31,812 29,914 25,987 23,587 21,885
Franchised restaurants 17,864 17,395 16,795 15,949 15,086 14,197 13,374 12,186 10,944 9,918 9,237
Company-operated
restaurants 9,000 8,378 7,652 6,059 5,433 4,887 4,294 3,783 3,216 2,733 2,551
Affiliated restaurants 4,244 4,320 4,260 4,301 3,994 3,844 3,216 2,330 1,739 1,476 1,305
Total Systemwide
restaurants 31,108 30,093 28,707 26,309 24,513 22,928 20,884 18,299 15,899 14,127 13,093
11-YEAR SUMMARY