Medtronic 2011 Annual Report Download - page 101
Download and view the complete annual report
Please find page 101 of the 2011 Medtronic annual report below. You can navigate through the pages in the report by either clicking on the pages listed below, or by using the keyword search tool below to find specific information within the annual report.-
 1
1 -
2
-
3
-
4
-
5
-
6
-
7
-
8
-
9
-
10
-
11
-
12
-
13
-
14
-
15
-
16
-
17
-
18
-
19
-
20
-
21
-
22
-
23
-
24
-
25
-
26
-
27
-
28
-
29
-
30
-
31
-
32
-
33
-
34
-
35
-
36
-
37
-
38
-
39
-
40
-
41
-
42
-
43
-
44
-
45
-
46
-
47
-
48
-
49
-
50
-
51
-
52
-
53
-
54
-
55
-
56
-
57
-
58
-
59
-
60
-
61
-
62
-
63
-
64
-
65
-
66
-
67
-
68
-
69
-
70
-
71
-
72
-
73
-
74
-
75
-
76
-
77
-
78
-
79
-
80
-
81
-
82
-
83
-
84
-
85
-
86
-
87
-
88
-
89
-
90
-
 91
91 -
 92
92 -
 93
93 -
 94
94 -
 95
95 -
 96
96 -
 97
97 -
 98
98 -
 99
99 -
 100
100 -
 101
101 -
 102
102 -
 103
103 -
 104
104 -
 105
105 -
 106
106
 |
 |

97
Medtronic, Inc.
segments. During the first quarter of fiscal year 2011, the two
operating groups were formally named the Cardiac and Vascular
Group (composed of the Cardiac Rhythm Disease Management,
CardioVascular, and Physio-Control businesses) and the Restorative
Therapies Group (composed of the Spinal, Neuromodulation,
Diabetes, and Surgical Technologies businesses). The primary
products sold by the Cardiac and Vascular Group include those
for cardiac rhythm disorders, cardiovascular disease, and external
defibrillation. The primary products sold by the Restorative
Therapies Group include those for spinal conditions and
musculoskeletal trauma, neurological disorders, urological
and digestive disorders, diabetes, and ear, nose, and throat
conditions. Accordingly, the segment information for the prior
years has been restated in accordance with authoritative guidance
on segment reporting.
The Company’s management evaluates performance and
allocates resources based on profit and loss from operations
before income taxes and interest expense, net, not including
special charges, restructuring charges, certain litigation charges,
net, acquisition-related items, and certain tax adjustments. The
accounting policies of the reportable segments are the same as
those described in the summary of significant accounting policies
in Note 1.
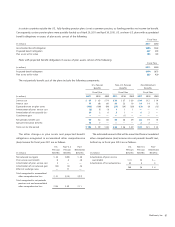
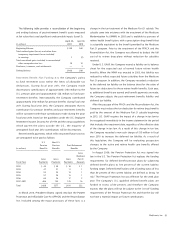
Net sales of the Company’s reportable segments include end-
customer revenues from the sale of products they each develop
and manufacture or distribute. Net sales and earnings before
income taxes by reportable segment are as follows:
Fiscal Year
(in millions) 2011 2010 2009
Cardiac and Vascular Group $ 8,544 $ 8,557 $ 7,794
Restorative Therapies Group 7,389 7,260 6,805
Total Net Sales $ 15,933 $ 15,817 $ 14,599
Fiscal Year
(in millions) 2011 2010 2009
Cardiac and Vascular Group $ 2,887 $ 2,935 $ 2,648
Restorative Therapies Group 2,085 2,024 1,823
Total Reportable Segments’ Earnings
Before Income Taxes 4,972 4,959 4,471
Special charges —— (100)
Restructuring charges (261)(50) (120)
Certain litigation charges, net (245)(374) (714)
Acquisition-related items (14)(23) (621)
Interest expense, net (278) (246) (183)
Corporate (451) (297) (293)
Total Earnings Before Income Taxes $ 3,723 $ 3,969 $ 2,440
The following table presents the Company’s net assets by
reportable segment:
(in millions)
April 2 9,
2011
April 30,
2010
Cardiac and Vascular Group $ 6,774 $ 6,117
Restorative Therapies Group 10,539 10,638
Total Net Assets of Reportable Segments 17,313 16,755
Short-term borrowings (1,723) (2,575)
Long-term debt (8,112) (6,944)
Corporate 8,490 7,393
Total Net Assets $15,968 $14,629
Geographic Information
Net sales to external customers by geography are as follows:
(in millions)
United
States Europe
Asia
Pacific
Other
Foreign
Consoli-
dated
Fiscal Year 2011
Net sales to external
customers $9,120 $ 4,084 $ 2,114 $615 $ 15,933
Long-lived assets* $2,225 $ 415 $ 158 $ 75 $ 2,873
Fiscal Year 2010
Net sales to external
customers $9,366 $ 4,014 $ 1,903 $534 $ 15,817
Long-lived assets* $2,043 $ 393 $ 161 $ 72 $ 2,669
Fiscal Year 2009
Net sales to external
customers $8,987 $ 3,564 $ 1,558 $490 $ 14,599
Long-lived assets* $2,036 $ 482 $ 126 $ 51 $ 2,695
* Excludes other long-term instruments, goodwill, other intangible assets, net, and
long-term deferred tax assets, net, as applicable.
No single customer represented over 10 percent of the Company’s
consolidated net sales in fiscal years 2011, 2010, or 2009.