Medtronic 2011 Annual Report Download - page 23
Download and view the complete annual report
Please find page 23 of the 2011 Medtronic annual report below. You can navigate through the pages in the report by either clicking on the pages listed below, or by using the keyword search tool below to find specific information within the annual report.-
 1
1 -
2
-
3
-
4
-
5
-
6
-
7
-
8
-
9
-
10
-
11
-
12
-
 13
13 -
 14
14 -
 15
15 -
 16
16 -
 17
17 -
 18
18 -
 19
19 -
 20
20 -
 21
21 -
 22
22 -
 23
23 -
 24
24 -
 25
25 -
 26
26 -
 27
27 -
 28
28 -
 29
29 -
 30
30 -
 31
31 -
 32
32 -
 33
33 -
34
-
35
-
36
-
37
-
38
-
39
-
40
-
41
-
42
-
43
-
44
-
45
-
46
-
47
-
48
-
49
-
50
-
51
-
52
-
53
-
54
-
55
-
56
-
57
-
58
-
59
-
60
-
61
-
62
-
63
-
64
-
65
-
66
-
67
-
68
-
69
-
70
-
71
-
72
-
73
-
74
-
75
-
76
-
77
-
78
-
79
-
80
-
81
-
82
-
83
-
84
-
85
-
86
-
87
-
88
-
89
-
90
-
91
-
92
-
93
-
94
-
95
-
96
-
97
-
98
-
99
-
100
-
101
-
102
-
103
-
104
-
105
-
106
 |
 |

19
Medtronic, Inc.
Net earnings for the fiscal year ended April 29, 2011 were $3.096
billion, or flat compared to net earnings of $3.099 billion for the
fiscal year ended April 30, 2010. Diluted earnings per share were
$2.86, or an increase of 3 percent compared to diluted earnings
per share of $2.79 for the fiscal years ended April 29, 2011 and
April 30, 2010, respectively. Fiscal year 2011 net earnings included
after-tax restructuring charges, certain litigation charges, net, and
acquisition-related items that decreased net earnings by $432
million and had a $0.39 impact on diluted earnings per share.
Fiscal year 2010 net earnings included after-tax restructuring
charges, certain litigation charges, net, and acquisition-related
items that decreased net earnings by $374 million and had a $0.34
impact on diluted earnings per share. See further discussion of
these charges/benefits in the “Special Charges, Restructuring
Items, and Certain Tax Adjustments” section of this management’s
discussion and analysis.
Net Sales
Fiscal Year
(dollars in millions) 2011 2010 % Change
Cardiac and Vascular Group $ 8,544 $ 8,557 —%
Restorative Therapies Group 7,389 7,260 2
Total Net Sales $ 15,933 $ 15,817 1
Net sales in fiscal year 2011 were $15.933 billion, an increase of
1 percent from the prior fiscal year. Foreign currency translation
had a favorable impact of $12 million on net sales when compared
to the prior fiscal year. The extra selling week in the prior fiscal
year had an unfavorable impact on current fiscal year net sales
growth. Although we cannot precisely calculate the effect of
the extra selling week across each of our businesses, we estimate
it had a $200 million unfavorable impact on net sales when
comparing the current fiscal year to the prior fiscal year. Net sales
growth for fiscal year 2011 was driven by a 2 percent increase in
the Restorative Therapies Group compared to the prior fiscal year.
The Cardiac and Vascular Group’s performance was flat compared
to the prior fiscal year. The Restorative Therapies Group’s
performance was primarily a result of strong net sales in Diabetes
and Surgical Technologies partially offset by softer net sales
in Spinal. Specifically, performance was also impacted by the
continued macroeconomic downturn, increased payor scrutiny,
competition, and the recent launch of notable products. The
Cardiac and Vascular Group’s performance was a result of strong
sales in our CardioVascular and Atrial Fibrillation Solutions (AF
Solutions) businesses, offset by declines in CRDM defibrillation
systems and pacing systems. Additionally, performance was
impacted by pricing pressures due to competition, slowing of
certain market growth rates, and reduced reimbursement in
certain countries including Japan, where R-Zone and foreign
reference pricing changes resulted in a decline in our selling
prices. Net sales growth for fiscal year 2011 was also impacted by
a CRDM competitor’s stop shipment in the prior fiscal year. Net
sales outside the United States (U.S.) were $6.813 billion compared
to $6.451 billion for the prior fiscal year. Growth outside the U.S.
continued to be strong, with five of our businesses achieving
positive growth rates as well as three of those businesses
achieving double-digit growth rates. See our discussion in the
“Net Sales” section of this management’s discussion and analysis
for more information on the results of our operating segments.
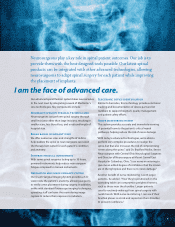
We remain committed to our Mission of developing lifesavi ng
and life-enhancing therapies to alleviate pain, restore health,
and extend life. The diversity and depth of our current product
offerings enable us to provide medical therapies to patients
worldwide. We work to improve patient access through well-
planned studies which show the safety, efficacy, and cost-
effectiveness of our therapies, and our alliances with patients,
clinicians, regulators, and reimbursement agencies. Our
investments in research and development, strategic acquisitions,
expanded clinical trials, and infrastructure provide the foundation
for our growth. We are confident in our ability to drive long-term
shareholder value using principles of our Mission, our strong
product pipelines, and our continued commitment to innovative
research and development.