Medtronic 2011 Annual Report Download - page 90
Download and view the complete annual report
Please find page 90 of the 2011 Medtronic annual report below. You can navigate through the pages in the report by either clicking on the pages listed below, or by using the keyword search tool below to find specific information within the annual report.-
 1
1 -
2
-
3
-
4
-
5
-
6
-
7
-
8
-
9
-
10
-
11
-
12
-
13
-
14
-
15
-
16
-
17
-
18
-
19
-
20
-
21
-
22
-
23
-
24
-
25
-
26
-
27
-
28
-
29
-
30
-
31
-
32
-
33
-
34
-
35
-
36
-
37
-
38
-
39
-
40
-
41
-
42
-
43
-
44
-
45
-
46
-
47
-
48
-
49
-
50
-
51
-
52
-
53
-
54
-
55
-
56
-
57
-
58
-
59
-
60
-
61
-
62
-
63
-
64
-
65
-
66
-
67
-
68
-
69
-
70
-
71
-
72
-
73
-
74
-
75
-
76
-
77
-
78
-
79
-
 80
80 -
 81
81 -
 82
82 -
 83
83 -
 84
84 -
 85
85 -
 86
86 -
 87
87 -
 88
88 -
 89
89 -
 90
90 -
 91
91 -
 92
92 -
 93
93 -
 94
94 -
 95
95 -
 96
96 -
 97
97 -
 98
98 -
 99
99 -
 100
100 -
101
-
102
-
103
-
104
-
105
-
106
 |
 |

86 Medtronic, Inc.
Notes to Consolidated Financial Statements
(continued)
In the U.S., the Company maintains a qualified pension plan
designed to provide guaranteed minimum retirement benefits
to all eligible U.S. employees. Pension coverage for non-U.S.
employees of the Company is provided, to the extent deemed
appropriate, through separate plans. In addition, U.S. and Puerto
Rico employees of the Company are also eligible to receive
specified Company paid health care and life insurance benefits
through the Company’s post-retirement benefits. In addition to
the benefits provided under the qualified pension plan, retirement
benefits associated with wages in excess of the IRS allowable
limits are provided to certain employees under a non-qualified plan.
A
status of the Company’s benefit plans was $253 million and $411
million, respectively.
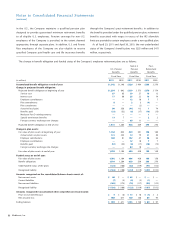
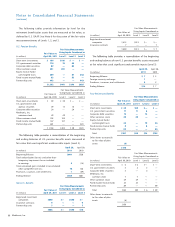
The change in benefit obligation and funded status of the Company’s employee retirement plans are as follows:
U.S. Pension
Benefits
Non-U.S.
Pension
Benefits
Post-
Retirement
Benefits
Fiscal Year Fiscal Year Fiscal Year
(in millions) 2011 2010 2011 2010 2011 2010
Accumulated benefit obligation at end of year: $ 1,342 $ 1 ,146 $ 526 $ 434 $ 295 $ 270
Change in projected benefit obligation:
Projected benefit obligation at beginning of year $ 1,284 $ 842 $ 539 $ 373 $ 270 $ 174
Service cost 87 63 39 27 18 12
Interest cost 77 68 25 22 16 14
Employee contributions — — 12 10 7 7
Plan amendments 8 — 2 3 (4) —
Plan curtailments — — — (2) — —
Actuarial loss/(gain) 80 336 (41) 112 1 74
Benefits paid (33) (32) (6) (17) (16) (13)
Medicare Part D reimbursements — — — — 1 —
Special termination benefits 13 7 — — 2 2
Foreign currency exchange rate changes — — 68 11 — —
Projected benefit obligation at end of year 1,516 1,284 638 539 295 270
Change in plan assets:
Fair value of plan assets at beginning of year 1,104 833 420 291 158 108
Actual return on plan assets 141 222 14 79 21 30
Employer contributions 180 81 102 47 28 26
Employee contributions — — 12 10 7 7
Benefits paid (33) (32) (6) (17) (16) (13)
Foreign currency exchange rate changes — — 64 10 — —
Fair value of plan assets at end of year 1,392 1,104 606 420 198 158
Funded status at end of year:
Fair value of plan assets 1,392 1,104 606 420 198 158
Benefit obligations 1,516 1,284 638 539 295 270
Underfunded status of the plans (124) (180) (32) (119) (97) (112)
Recognized liability $ (124) $ (180) $ (32) $ (119) $ (97) $ (112)
Amounts recognized on the consolidated balance sheets consist of:
Non-current assets $ 46 $ — $ 45 $ — $ — $ —
Current liabilities (7) (5) (2) (2) (1) —
Non-current liabilities (163) (175) (75) (117) (96) (112)
Recognized liability $ (124) $ (180) $ (32) $ (119) $ (97) $ (112)
Amounts recognized in accumulated other comprehensive (loss)/income:
Prior service (benefit)/cost $ 4 $ (6) $ 13 $ 10 $ (3) $ 2
Net actuarial loss 688 677 130 148 83 95
Ending balance$ 692 $ 671 $ 143 $ 158 $ 80 $ 97