Medtronic 2011 Annual Report Download - page 91
Download and view the complete annual report
Please find page 91 of the 2011 Medtronic annual report below. You can navigate through the pages in the report by either clicking on the pages listed below, or by using the keyword search tool below to find specific information within the annual report.-
 1
1 -
2
-
3
-
4
-
5
-
6
-
7
-
8
-
9
-
10
-
11
-
12
-
13
-
14
-
15
-
16
-
17
-
18
-
19
-
20
-
21
-
22
-
23
-
24
-
25
-
26
-
27
-
28
-
29
-
30
-
31
-
32
-
33
-
34
-
35
-
36
-
37
-
38
-
39
-
40
-
41
-
42
-
43
-
44
-
45
-
46
-
47
-
48
-
49
-
50
-
51
-
52
-
53
-
54
-
55
-
56
-
57
-
58
-
59
-
60
-
61
-
62
-
63
-
64
-
65
-
66
-
67
-
68
-
69
-
70
-
71
-
72
-
73
-
74
-
75
-
76
-
77
-
78
-
79
-
80
-
 81
81 -
 82
82 -
 83
83 -
 84
84 -
 85
85 -
 86
86 -
 87
87 -
 88
88 -
 89
89 -
 90
90 -
 91
91 -
 92
92 -
 93
93 -
 94
94 -
 95
95 -
 96
96 -
 97
97 -
 98
98 -
 99
99 -
 100
100 -
 101
101 -
102
-
103
-
104
-
105
-
106
 |
 |

87
Medtronic, Inc.
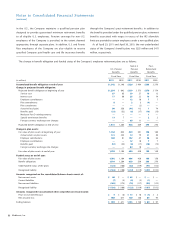
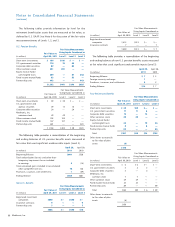
In certain countries outside the U.S., fully funding pension plans is not a common practice, as funding provides no income tax benefit.
Consequently, certain pension plans were partially funded as of April 29, 2011 and April 30, 2010. U.S. and non-U.S. plans with accumulated
benefit obligations in excess of plan assets consist of the following:
Fiscal Year
(in millions) 2011 2010
Accumulated benefit obligation $396 $363
Projected benefit obligation 437 393
Plan assets at fair value 193 183
Plans with projected benefit obligations in excess of plan assets consist of the following:
Fiscal Year
(in millions) 2011 2010
Projected benefit obligation $474 $675
Plan assets at fair value 225 420
The net periodic benefit cost of the plans include the following components:
U.S. Pension
Benefits
Non-U.S. Pension
Benefits
Post-Retirement
Benefits
Fiscal Year Fiscal Year Fiscal Year
(in millions) 2011 2010 2009 2011 2010 2009 2011 2010 2009
Service cost $ 87 $ 63 $ 74 $ 39 $ 27 $ 29 $ 18 $12 $ 14
Interest cost 77 68 60 26 22 19 16 14 12
Expected return on plan assets (106) (100) (99) (27) (24) (20) (13) (9) (12)
Amortization of prior service cost (2) (1) (1) 1 1 1 — — —
Amortization of net actuarial loss 34 2 6 5 1 — 5 2 —
Curtailment gain — — — — (1) — — — —
Net periodic benefit cost 90 32 40 44 26 29 26 19 14
Special termination benefits 13 7 — — — — 2 2 —
Total cost for the period $ 103 $ 39 $ 40 $ 44 $ 26 $ 29 $ 28 $21 $ 14
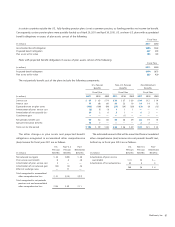
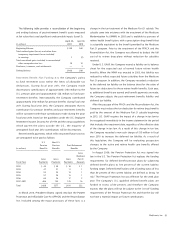
The other changes in plan assets and projected benefit
obligations recognized in accumulated other comprehensive
(loss)/income for fiscal year 2011 are as follows:
(in millions)
U.S.
Pension
Benefits
Non-U.S.
Pension
Benefits
Post-
Retirement
Benefits
Net actuarial loss/(gain) $ 45 $(29) $ (8)
Prior service cost/(credit) 8 2 (4)
Amortization of prior service cost 2 — —
Amortization of net actuarial gain (34) (5) (5)
Effect of exchange rates — 17 —
Total recognized in accumulated
other comprehensive loss $ 21 $(15) $(17)
Total recognized in net periodic
pension cost and accumulated
other comprehensive loss $124 $ 29 $ 11
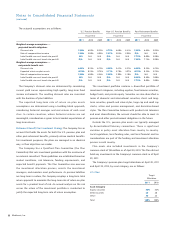
The estimated amounts that will be amortized from accumulated
other comprehensive (loss)/income into net periodic benefit cost,
before tax, in fiscal year 2012 are as follows:
(in millions)
U.S.
Pension
Benefits
Non-U.S.
Pension
Benefits
Post-
Retirement
Benefits
Amortization of prior service
cost/(credit) $ (1) $2 $—
Amortization of net actuarial loss 45 4 4
$44 $6 $ 4