Proctor and Gamble 2003 Annual Report Download - page 40
Download and view the complete annual report
Please find page 40 of the 2003 Proctor and Gamble annual report below. You can navigate through the pages in the report by either clicking on the pages listed below, or by using the keyword search tool below to find specific information within the annual report.-
 1
1 -
2
-
3
-
4
-
5
-
6
-
7
-
8
-
9
-
10
-
11
-
12
-
13
-
14
-
15
-
16
-
17
-
18
-
19
-
20
-
21
-
22
-
23
-
24
-
25
-
26
-
27
-
28
-
29
-
 30
30 -
 31
31 -
 32
32 -
 33
33 -
 34
34 -
 35
35 -
 36
36 -
 37
37 -
 38
38 -
 39
39 -
 40
40 -
 41
41 -
 42
42 -
 43
43 -
 44
44 -
 45
45 -
 46
46 -
 47
47 -
 48
48 -
 49
49 -
 50
50 -
51
-
52
-
53
-
54
-
55
-
56
-
57
-
58
-
59
-
60
 |
 |

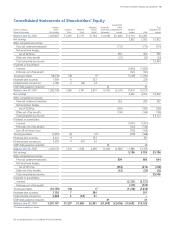
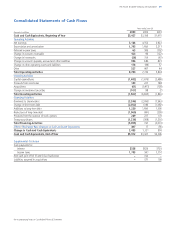
See accompanying Notes to Consolidated Financial Statements
The Procter & Gamble Company and Subsidiaries 38
Balance June 30, 2000
Net earnings
Other comprehensive income:
Financial statement translation
Net investment hedges,
net of $276 tax
Other, net of tax benefit
Total comprehensive income
Dividends to shareholders:
Common
Preferred, net of tax benefit
Treasury purchases
Employee plan issuances
Preferred stock conversions
ESOP debt guarantee reduction
Balance June 30, 2001
Net earnings
Other comprehensive income:
Financial statement translation
Net investment hedges,
net of $238 tax
Other, net of tax benefits
Total comprehensive income
Dividends to shareholders:
Common
Preferred, net of tax benefits
Spin-off of Jif and Crisco
Treasury purchases
Employee plan issuances
Preferred stock conversions
ESOP debt guarantee reduction
Balance June 30, 2002
Net earnings
Other comprehensive income:
Financial statement translation
Net investment hedges,
net of $251 tax
Other, net of tax benefits
Total comprehensive income
Dividends to shareholders:
Common
Preferred, net of tax benefit
Treasury purchases
Employee plan issuances
Preferred stock conversions
ESOP debt guarantee reduction
Balance June 30, 2003
Dollars in millions/
Shares in thousands
Consolidated Statements of Shareholders’ Equity
$1,306
(18)
6
2
1,296
(8)
9
4
1,301
(14)
7
3
$1,297
Common
Stock
$1,737
(36)
1,701
(67)
1,634
(54)
$1,580
Preferred
Stock
$(1,418)
43
(1,375)
36
(1,339)
31
$(1,308)
Reserve for
ESOP Debt
Retirement
$(1,842)
(715)
460
(23)
(2,120)
263
(397)
(106)
(2,360)
804
(418)
(32)
$(2,006)
Accumulated
Other
Comprehensive
Income
$10,710
2,922
(1,822)
(121)
(1,238)
10,451
4,352
(1,971)
(124)
(150)
(578)
11,980
5,186
(2,121)
(125)
(1,228)
$13,692
Retained
Income
$12,287
2,922
(715)
460
(23)
(1,822)
(121)
(1,250)
229
–
43
12,010
4,352
263
(397)
(106)
(1,971)
(124)
(150)
(568)
361
–
36
13,706
5,186
804
(418)
(32)
(2,121)
(125)
(1,236)
391
–
31
$16,186
Total
$2,922
(715)
460
(23)
$2,644
$4,352
263
(397)
(106)
$4,112
$5,186
804
(418)
(32)
$5,540
Total
Comprehensive
Income
1,305,867
(18,238)
5,924
2,185
1,295,738
(7,681)
8,323
4,390
1,300,770
(14,138)
7,156
3,409
1,297,197
Common
Shares
Outstanding
$1,794
6
223
34
2,057
18
352
63
2,490
6
384
51
$2,931
Additional
Paid-In
Capital
(1)
(1)
(1)
(1) Premium on equity put options.