Proctor and Gamble 2003 Annual Report Download - page 57
Download and view the complete annual report
Please find page 57 of the 2003 Proctor and Gamble annual report below. You can navigate through the pages in the report by either clicking on the pages listed below, or by using the keyword search tool below to find specific information within the annual report.-
 1
1 -
2
-
3
-
4
-
5
-
6
-
7
-
8
-
9
-
10
-
11
-
12
-
13
-
14
-
15
-
16
-
17
-
18
-
19
-
20
-
21
-
22
-
23
-
24
-
25
-
26
-
27
-
28
-
29
-
30
-
31
-
32
-
33
-
34
-
35
-
36
-
37
-
38
-
39
-
40
-
41
-
42
-
43
-
44
-
45
-
46
-
 47
47 -
 48
48 -
 49
49 -
 50
50 -
 51
51 -
 52
52 -
 53
53 -
 54
54 -
 55
55 -
 56
56 -
 57
57 -
 58
58 -
 59
59 -
 60
60
 |
 |

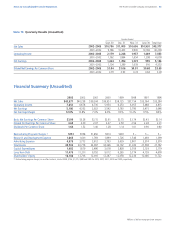
Notes to Consolidated Financial Statements 55The Procter & Gamble Company and Subsidiaries
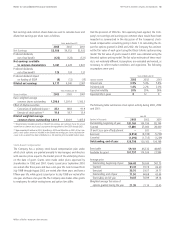
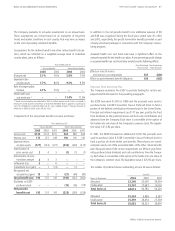
Note 13 Quarterly Results (Unaudited)
Millions of dollars except per share amounts
Quarters Ended
Net Sales
Operating Income
Net Earnings
Diluted Net Earnings Per Common Share
Sept. 30
$10,796
9,766
2,179
1,762
1,464
1,104
$1.04
0.79
Dec. 31
$11,005
10,403
2,248
1,864
1,494
1,299
$1.06
0.93
Mar. 31
$10,656
9,900
1,957
1,654
1,273
1,039
$0.91
0.74
June 30
$10,920
10,169
1,469
1,398
955
910
$0.68
0.64
Total Year
$43,377
40,238
7,853
6,678
5,186
4,352
$3.69
3.09
2002–2003
2001–2002
2002–2003
2001–2002
2002–2003
2001–2002
2002–2003
2001–2002
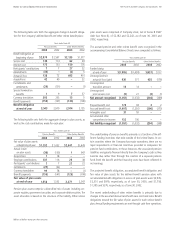
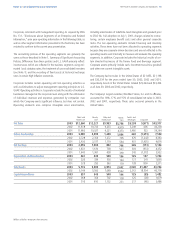
Financial Summary (Unaudited)
1999
$38,125
6,253
3,763
9.9%
$2.75
2.59
1.14
$481
1,726
3,639
32,192
2,828
6,265
12,058
2000
$39,951
5,954
3,542
8.9%
$2.61
2.47
1.28
$814
1,899
3,793
34,366
3,018
9,012
12,287
1998
$37,154
6,055
3,780
10.2%
$2.74
2.56
1.01
$ –
1,546
3,801
31,042
2,559
5,774
12,236
1997
$35,764
5,488
3,415
9.5%
$2.43
2.28
0.90
$ –
1,469
3,574
27,598
2,129
4,159
12,046
1996
$35,284
4,815
3,046
8.6%
$2.14
2.01
0.80
$ –
1,399
3,374
27,762
2,179
4,678
11,722
2001
$39,244
4,736
2,922
7.4%
$2.15
2.07
1.40
$1,850
1,769
3,612
34,387
2,486
9,792
12,010
2002
$40,238
6,678
4,352
10.8%
$3.26
3.09
1.52
$958
1,601
3,773
40,776
1,679
11,201
13,706
2003
$43,377
7,853
5,186
12.0%
$3.90
3.69
1.64
$751
1,665
4,373
43,706
1,482
11,475
16,186
Net Sales
Operating Income
Net Earnings
Net Earnings Margin
Basic Net Earnings Per Common Share
Diluted Net Earnings Per Common Share
Dividends Per Common Share
Restructuring Program Charges
(1)
Research and Development Expense
Advertising Expense
Total Assets
Capital Expenditures
Long-Term Debt
Shareholders’ Equity
(1) Restructuring program charges, on an after-tax basis, totaled $538, $706, $1,475, $688 and $385 for 2003, 2002, 2001, 2000 and 1999, respectively.