Proctor and Gamble 2003 Annual Report Download - page 54
Download and view the complete annual report
Please find page 54 of the 2003 Proctor and Gamble annual report below. You can navigate through the pages in the report by either clicking on the pages listed below, or by using the keyword search tool below to find specific information within the annual report.-
 1
1 -
2
-
3
-
4
-
5
-
6
-
7
-
8
-
9
-
10
-
11
-
12
-
13
-
14
-
15
-
16
-
17
-
18
-
19
-
20
-
21
-
22
-
23
-
24
-
25
-
26
-
27
-
28
-
29
-
30
-
31
-
32
-
33
-
34
-
35
-
36
-
37
-
38
-
39
-
40
-
41
-
42
-
43
-
 44
44 -
 45
45 -
 46
46 -
 47
47 -
 48
48 -
 49
49 -
 50
50 -
 51
51 -
 52
52 -
 53
53 -
 54
54 -
 55
55 -
 56
56 -
 57
57 -
 58
58 -
 59
59 -
 60
60
 |
 |

52Notes to Consolidated Financial Statements The Procter & Gamble Company and Subsidiaries
The Company’s effective income tax rate was 31.1%, 31.8% and
36.7% in 2003, 2002 and 2001, respectively, compared to the U.S.
statutory rate of 35.0%. The country mix impacts of foreign operations
reduced the Company’s effective tax rate to a larger degree in 2003
and 2002 than in 2001 – 3.8% in 2003 and 3.1% in 2002. The Com-
pany’s higher tax rate in 2001 reflected the impact of restructuring
costs and amortization of goodwill and indefinite-lived intangibles prior
to the adoption of SFAS No. 142. Taxes impacted shareholders’ equity
with credits of $361 and $477 for the years ended June 30, 2003 and
2002, respectively. These primarily relate to the tax effects of net in-
vestment hedges and tax benefits from the exercise of stock options.
The Company has undistributed earnings of foreign subsidiaries of
$14,021 at June 30, 2003, for which deferred taxes have not been pro-
vided. Such earnings are considered indefinitely invested in the foreign
subsidiaries. If such earnings were repatriated additional tax expense
may result, although the calculation of such additional taxes is not
practicable.
Realization of certain deferred tax assets is dependent upon generating
sufficient taxable income in the appropriate jurisdiction prior to expira-
tion of the carryforward periods. Although realization is not assured,
management believes it is more likely than not the deferred tax assets,
net of applicable valuation allowances, will be realized.
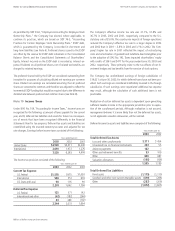
Deferred income tax assets and liabilities were comprised of the following:
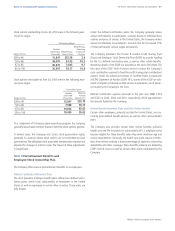
As permitted by SOP 93-6, “Employers Accounting for Employee Stock
Ownership Plans,“ the Company has elected, where applicable, to
continue its practices, which are based on SOP 76-3, “Accounting
Practices for Certain Employee Stock Ownership Plans.” ESOP debt,
which is guaranteed by the Company, is recorded in short-term and
long-term liabilities (see Note 6). Preferred shares issued to the ESOP
are offset by the reserve for ESOP debt retirement in the Consolidated
Balance Sheets and the Consolidated Statements of Shareholders’
Equity. Interest incurred on the ESOP debt is recorded as interest ex-
pense. Dividends on all preferred shares, net of related tax benefits, are
charged to retained earnings.
The preferred shares held by the ESOP are considered outstanding from
inception for purposes of calculating diluted net earnings per common
share. Diluted net earnings are calculated assuming that all preferred
shares are converted to common, and therefore are adjusted to reflect the
incremental ESOP funding that would be required due to the difference in
dividend rate between preferred and common shares (see Note 8).
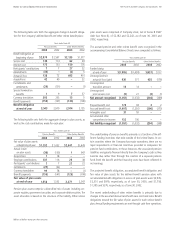
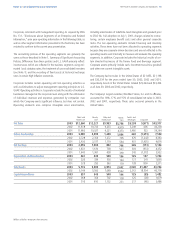
Note 10 Income Taxes
Under SFAS No. 109, “Accounting for Income Taxes,” income taxes are
recognized for the following: a) amount of taxes payable for the current
year, and b) deferred tax liabilities and assets for future tax consequen-
ces of events that have been recognized differently in the financial
statements than for tax purposes. Deferred tax assets and liabilities are
established using the enacted statutory tax rates and adjusted for tax
rate changes. Earnings before income taxes consisted of the following:
The income tax provision consisted of the following:
Millions of dollars except per share amounts
United States
International
Years ended June 30
2001
$3,340
1,276
4,616
2002
$4,411
1,972
6,383
2003
$4,920
2,610
7,530
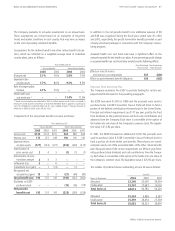
Current Tax Expense
U.S. Federal
International
U.S. State and Local
Deferred Tax Expense
U.S. Federal
International and other
Years ended June 30
2001
$1,030
676
90
1,796
142
(244)
(102)
1,694
2002
$975
551
116
1,642
571
(182)
389
2,031
2003
$1,595
588
98
2,281
125
(62)
63
2,344
Total Deferred Tax Assets
Loss and other carryforwards
Unrealized loss on financial instruments
Advance payments
Other postretirement benefits
Other
Valuation allowances
Total Deferred Tax Liabilities
Fixed assets
Goodwill and other non-current intangible assets
Other
Years ended June 30
2002
$ 454
55
–
109
687
(106)
1,199
(1,110)
(286)
(209)
(1,605)
2003
$ 311
287
182
93
820
(158)
1,535
(1,175)
(410)
(287)
(1,872)