Proctor and Gamble 2003 Annual Report Download - page 56
Download and view the complete annual report
Please find page 56 of the 2003 Proctor and Gamble annual report below. You can navigate through the pages in the report by either clicking on the pages listed below, or by using the keyword search tool below to find specific information within the annual report.-
 1
1 -
2
-
3
-
4
-
5
-
6
-
7
-
8
-
9
-
10
-
11
-
12
-
13
-
14
-
15
-
16
-
17
-
18
-
19
-
20
-
21
-
22
-
23
-
24
-
25
-
26
-
27
-
28
-
29
-
30
-
31
-
32
-
33
-
34
-
35
-
36
-
37
-
38
-
39
-
40
-
41
-
42
-
43
-
44
-
45
-
 46
46 -
 47
47 -
 48
48 -
 49
49 -
 50
50 -
 51
51 -
 52
52 -
 53
53 -
 54
54 -
 55
55 -
 56
56 -
 57
57 -
 58
58 -
 59
59 -
 60
60
 |
 |

54Notes to Consolidated Financial Statements The Procter & Gamble Company and Subsidiaries
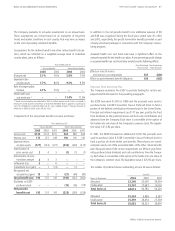
including amortization of indefinite-lived intangibles and goodwill prior
to SFAS No. 142 adoption on July 1, 2001, charges related to restruc-
turing, certain employee benefit costs and other general corporate
items. The non-operating elements include financing and investing
activities. These items have not been allocated to operating segments
because they are corporate-driven decisions and are not reflected in the
operating results used internally to measure and evaluate the operating
segments. In addition, Corporate includes the historical results of cer-
tain divested businesses of the former Food and Beverage segment.
Corporate assets primarily include cash, investment securities, goodwill
and other non-current intangible assets.
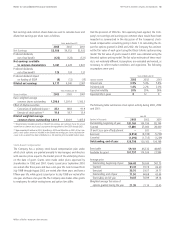
The Company had net sales in the United States of $21,853, $21,198
and $20,334 for the years ended June 30, 2003, 2002 and 2001,
respectively. Assets in the United States totaled $23,424 and $23,434
as of June 30, 2003 and 2002, respectively.
The Company’s largest customer, Wal-Mart Stores, Inc. and its affiliates,
accounted for 18%, 17% and 15% of consolidated net sales in 2003,
2002 and 2001, respectively. These sales occurred primarily in the
United States.
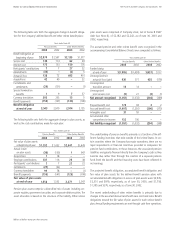
Corporate, consistent with management reporting. As required by SFAS
No. 131, “Disclosures about Segments of an Enterprise and Related
Information,” prior year operating information in the following table, as
well as other segment information presented in the footnotes, has been
restated to conform to the current year presentation.
The accounting policies of the operating segments are generally the
same as those described in Note 1, Summary of Significant Accounting
Policies. Differences from these policies and U.S. GAAP primarily reflect:
income taxes, which are reflected in the business segments using esti-
mated local statutory rates; the treatment of unconsolidated investees
(see Note 1); and the recording of fixed assets at historical exchange
rates in certain high inflation economies.
Corporate includes certain operating and non-operating activities as
well as eliminations to adjust management reporting principles to U.S.
GAAP. Operating activities in Corporate include the results of incidental
businesses managed at the corporate level along with the elimination
of individual revenues and expenses generated by companies over
which the Company exerts significant influence, but does not control.
Operating elements also comprise intangible asset amortization,
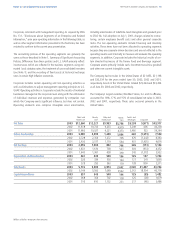
Millions of dollars except per share amounts
Fabric and
Home Care
Net Sales
Before-Tax Earnings
Net Earnings
Depreciation and Amortization
Total Assets
Capital Expenditures
$12,560
11,618
11,660
3,080
2,728
2,430
2,059
1,831
1,643
332
326
328
5,174
5,149
357
368
516
$9,933
9,233
9,221
1,448
1,272
1,119
882
738
658
558
503
563
6,974
7,069
548
702
1,152
$12,221
10,723
10,027
2,899
2,354
2,017
1,984
1,610
1,361
345
339
293
5,389
5,500
343
354
416
$5,796
4,979
4,353
1,034
795
584
706
521
390
156
163
159
2,642
2,542
144
158
231
$3,238
3,249
3,460
460
476
401
306
303
242
125
121
128
2,040
2,012
125
125
217
$(371)
436
523
(1,391)
(1,242)
(1,935)
(751)
(651)
(1,372)
187
241
800
21,487
18,504
(35)
(28)
(46)
$43,377
40,238
39,244
7,530
6,383
4,616
5,186
4,352
2,922
1,703
1,693
2,271
43,706
40,776
1,482
1,679
2,486
2003
2002
2001
2003
2002
2001
2003
2002
2001
2003
2002
2001
2003
2002
2003
2002
2001
Beauty
Care
Baby and
Family Care Health
Care
Snacks and
Beverages
Corporate
Total