Proctor and Gamble 2003 Annual Report Download - page 53
Download and view the complete annual report
Please find page 53 of the 2003 Proctor and Gamble annual report below. You can navigate through the pages in the report by either clicking on the pages listed below, or by using the keyword search tool below to find specific information within the annual report.-
 1
1 -
2
-
3
-
4
-
5
-
6
-
7
-
8
-
9
-
10
-
11
-
12
-
13
-
14
-
15
-
16
-
17
-
18
-
19
-
20
-
21
-
22
-
23
-
24
-
25
-
26
-
27
-
28
-
29
-
30
-
31
-
32
-
33
-
34
-
35
-
36
-
37
-
38
-
39
-
40
-
41
-
42
-
 43
43 -
 44
44 -
 45
45 -
 46
46 -
 47
47 -
 48
48 -
 49
49 -
 50
50 -
 51
51 -
 52
52 -
 53
53 -
 54
54 -
 55
55 -
 56
56 -
 57
57 -
 58
58 -
 59
59 -
 60
60
 |
 |

Notes to Consolidated Financial Statements 51The Procter & Gamble Company and Subsidiaries
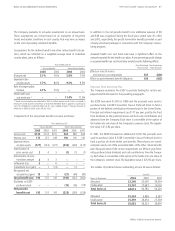
In addition to the net periodic benefit cost, additional expense of $8
and $46 was recognized during the fiscal years ended June 30, 2003
and 2002, respectively, for special termination benefits provided as part
of early retirement packages in connection with the Company’s restruc-
turing program.
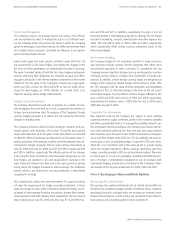
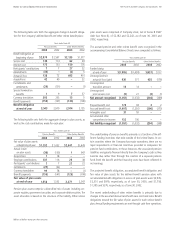
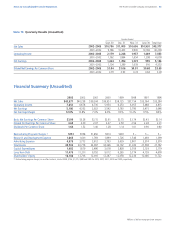
Assumed health care cost trend rates have a significant effect on the
amounts reported for the health care plans. A one-percentage point change
in assumed health care cost trend rates would have the following effects:
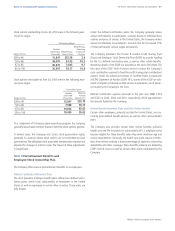
Employee Stock Ownership Plan
The Company maintains the ESOP to provide funding for certain em-
ployee benefits discussed in the preceding paragraphs.
The ESOP borrowed $1,000 in 1989 and the proceeds were used to
purchase Series A ESOP Convertible Class A Preferred Stock to fund a
portion of the defined contribution retirement plan in the United States.
Principal and interest requirements are $117 per year, paid by the Trust
from dividends on the preferred shares and from cash contributions and
advances from the Company. Each share is convertible at the option of
the holder into one share of the Company’s common stock. The liquida-
tion value is $13.64 per share.
In 1991, the ESOP borrowed an additional $1,000. The proceeds were
used to purchase Series B ESOP Convertible Class A Preferred Stock to
fund a portion of retiree health care benefits. These shares are consid-
ered plan assets, net of the associated debt, of the other retiree benefits
plan discussed above. Debt service requirements are $94 per year, fund-
ed by preferred stock dividends and cash contributions from the Compa-
ny. Each share is convertible at the option of the holder into one share of
the Company’s common stock. The liquidation value is $25.92 per share.
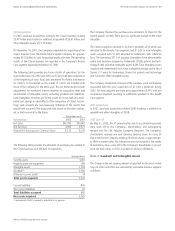
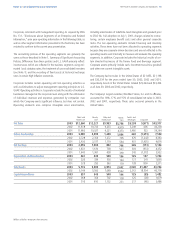
The number of preferred shares outstanding at June 30 was as follows:
The Company evaluates its actuarial assumptions on an annual basis.
These assumptions are revised based on an evaluation of long-term
trends and market conditions in each country that may have an impact
on the cost of providing retirement benefits.
Assumptions for the defined benefit and other retiree benefit calcula-
tions, which are reflected on a weighted average basis of individual
country plans, were as follows:
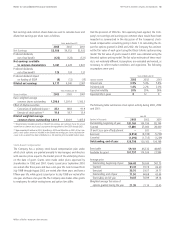
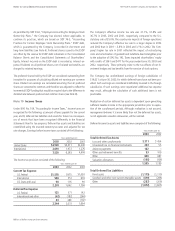
Components of the net periodic benefit cost were as follows:
(1) Trend rate assumption was adjusted in 2003 to reflect market trends. Rate is assumed to
decrease to 5.0% by 2010 and remain at that level thereafter. Rate is applied to current plan
costs net of Medicare; estimated initial rate for “gross eligible charges” (charges inclusive of
Medicare) is 8.8% for 2003 and 9.1% for 2002.
Millions of dollars except share amounts
2002
5.6%
8.6%
3.5%
–
Discount rate
Expected return
on plan assets
Rate of compensation
increase
Initial health care
cost trend rate (1)
2003
5.1%
7.7%
3.1%
–
2002
7.0%
9.5%
–
11.3%
2003
5.8%
9.5%
–
11.4%
Years ended June 30
Pension Benefits Other Retiree Benefits
2001
$115
149
(127)
5
3
6
(13)
3
141
–
141
Service cost
Interest cost
Expected return
on plan assets
Amortization of
prior service cost
Amortization of prior
transition amount
Settlement loss
Curtailment loss (gain)
Recognized net
actuarial loss (gain)
Gross benefit cost
Dividends on ESOP
preferred stock
Net periodic
benefit cost
Years ended June 30
2002
$114
153
(133)
4
3
–
1
9
151
–
151
2003
$124
173
(127)
2
2
5
–
13
192
–
192
2001
$40
101
(317)
(1)
–
–
–
(85)
(262)
(76)
(338)
2002
$49
116
(320)
(1)
–
–
(1)
(64)
(221)
(76)
(297)
2003
$62
150
(333)
(1)
–
–
–
(27)
(149)
(74)
(223)
Pension Benefits Other Retiree Benefits
Allocated
Unallocated
Total Series A
Allocated
Unallocated
Total Series B
June 30
Shares in Thousands
2001
34,459
19,761
54,220
9,267
27,338
36,605
2002
33,095
17,687
50,782
9,869
26,454
36,323
2003
32,246
15,767
48,013
10,324
25,359
35,683
One-Percentage
Point Increase
$37
435
Effect on total of service
and interest cost components
Effect on postretirement benefit obligation
One-Percentage
Point Decrease
$(30)
(422)