Starbucks 2001 Annual Report Download - page 15
Download and view the complete annual report
Please find page 15 of the 2001 Starbucks annual report below. You can navigate through the pages in the report by either clicking on the pages listed below, or by using the keyword search tool below to find specific information within the annual report.-
 1
1 -
2
-
3
-
4
-
 5
5 -
 6
6 -
 7
7 -
 8
8 -
 9
9 -
 10
10 -
 11
11 -
 12
12 -
 13
13 -
 14
14 -
 15
15 -
 16
16 -
 17
17 -
 18
18 -
 19
19 -
 20
20 -
 21
21 -
 22
22 -
 23
23 -
 24
24 -
 25
25 -
26
-
27
-
28
-
29
-
30
-
31
-
32
-
33
-
34
-
35
-
36
 |
 |

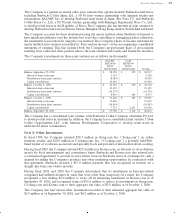
Fiscal 2001 Annual Report 31
Consolidated Statements of Cash Flows
In thousands
Fiscal year ended Sept 30, 2001 Oct 1, 2000 Oct 3, 1999
OPERATING ACTIVITIES:
Net earnings $ 181,210 $ 94,564 $ 101,693
Adjustments to reconcile net earnings to net cash provided
by operating activities:
Depreciation and amortization 177,087 142,171 107,512
Internet-related investment losses 2,940 58,792 -
Provision for losses on asset disposals 11,044 5,753 2,456
Deferred income taxes, net (6,068) (18,252) 794
Equity in income of investees (15,713) (15,139) (2,318)
Tax benefit from exercise of nonqualified stock options 30,899 31,131 18,621
Cash provided/ (used) by changes in operating assets and liabilities:
Net purchases of trading securities (4,032) (1,414) -
Accounts receivable (17,177) (25,013) 3,838
Inventories (19,704) (19,495) (36,405)
Prepaid expenses and other current assets (10,919) (700) (7,552)
Accounts payable 54,117 15,561 4,711
Accrued compensation and related costs 12,098 30,962 7,586
Accrued occupancy costs 6,797 6,007 5,517
Accrued taxes 34,548 5,026 12,429
Minority interest 1,346 3,126 400
Deferred revenue 2,626 6,836 (53)
Other accrued expenses 19,727 1,880 10,366
Net cash provided by operating activities 460,826 321,796 229,595
INVESTING ACTIVITIES:
Purchase of available-for-sale securities (184,187) (118,501) (122,800)
Maturity of available-for-sale securities 93,500 58,750 85,053
Sale of available-for-sale securities 46,931 49,238 3,633
Purchase of businesses, net of cash acquired - (13,522) (15,662)
Net investments in joint ventures (12,636) (8,473) (10,466)
Purchases of other investments (238) (35,457) (20,314)
Distributions from joint ventures 16,863 14,279 8,983
Additions to property, plant and equipment (384,215) (316,450) (257,854)
Additions to other assets (9,071) (6,318) (6,866)
Net cash used by investing activities (433,053) (376,454) (336,293)
FINANCING ACTIVITIES:
Increase/ (decrease) in cash provided by checks drawn
in excess of bank balances 5,655 (7,479) 29,512
Proceeds from sale of common stock under employee stock purchase plan 12,977 10,258 9,386
Proceeds from exercise of stock options 46,662 58,463 33,799
Principal payments on long-term debt (685) (1,889) (1,189)
Repurchase of common stock (49,788) - -
Net cash provided by financing activities 14,821 59,353 71,508
Effect of exchange rate changes on cash and cash equivalents (174) (297) (54)
Net increase/ (decrease) in cash and cash equivalents 42,420 4,398 (35,244)
CASH AND CASH EQUIVALENTS:
Beginning of year 70,817 66,419 101,663
End of year $ 113,237 $ 70,817 $ 66,419
SUPPLEMENTAL DISCLOSURE OF CASH FLOW INFORMATION:
Cash paid during the year for:
Interest $ 432 $ 411 $ 442
Income taxes 47,690 51,856 35,366
See Notes to Consolidated Financial Statements.