Starbucks 2001 Annual Report Download - page 31
Download and view the complete annual report
Please find page 31 of the 2001 Starbucks annual report below. You can navigate through the pages in the report by either clicking on the pages listed below, or by using the keyword search tool below to find specific information within the annual report.-
 1
1 -
2
-
3
-
4
-
5
-
6
-
7
-
8
-
9
-
10
-
11
-
12
-
13
-
14
-
15
-
16
-
17
-
18
-
19
-
20
-
 21
21 -
 22
22 -
 23
23 -
 24
24 -
 25
25 -
 26
26 -
 27
27 -
 28
28 -
 29
29 -
 30
30 -
 31
31 -
 32
32 -
 33
33 -
 34
34 -
 35
35 -
 36
36
 |
 |

Fiscal 2001 Annual Report 47
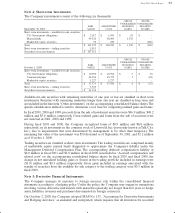
The tables below present information by operating segment (in thousands):
Fiscal year ended Sept 30, 2001 Oct 1, 2000 Oct 3, 1999
REVENUES:
North American retail $ 2,086,354 $ 1,734,929 $ 1,375,018
Business Alliances 193,574 160,812 126,888
All other business units 419,843 305,080 200,399
Intersegment revenues (50,791) (23,207) (15,477)
Total revenues $ 2,648,980 $ 2,177,614 $ 1,686,828
EARNINGS BEFORE INCOME TAXES:
North American retail $ 336,434 $ 249,924 $ 209,338
Business Alliances 50,165 43,777 33,098
All other business units 70,116 53,323 22,900
Unallocated corporate expenses (174,288) (134,902) (107,460)
Intersegment eliminations (1,333) 130 (1,165)
Operating income 281,094 212,252 156,711
Interest and other income, net 10,768 7,110 7,315
Internet-related investment losses (2,940) (58,792) -
Earnings before income taxes $ 288,922 $ 160,570 $ 164,026
DEPRECIATION AND AMORTIZATION:
North American retail $ 115,061 $ 94,312 $ 72,252
Business Alliances 5,278 3,547 2,561
All other business units 17,768 10,117 5,205
Unallocated corporate expenses 25,394 22,256 17,779
Total depreciation and amortization $ 163,501 $ 130,232 $ 97,797
INCOME FROM EQUITY METHOD INVESTEES:
All other business units $ 17,556 $ 15,139 $ 2,318
Intersegment eliminations 11,059 5,161 874
Total income from equity method investees $ 28,615 $ 20,300 $ 3,192
Sept 30, 2001 Oct 1, 2000
IDENTIFIABLE ASSETS:
North American retail $ 873,306 $ 664,773
Business Alliances 57,578 52,596
All other business units 217,027 111,521
General corporate assets 703,128 662,656
Total assets $ 1,851,039 $ 1,491,546
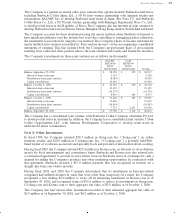
The tables below represent information by geographic area (in thousands):
Sept 30, 2001 Oct 1, 2000 Oct 3, 1999
REVENUES FROM EXTERNAL CUSTOMERS:
United States $ 2,301,013 $ 1,910,092 $ 1,467,410
Foreign countries 347,967 267,522 219,418
Total $ 2,648,980 $ 2,177,614 $ 1,686,828
Revenues from foreign countries are based on the location of the customers and consist primarily of
retail revenues from Canada and the United Kingdom as well as specialty revenues generated from
product sales to its international licensees. No customer accounts for 10% or more of the Company’s
revenues.
Sept 30, 2001 Oct 1, 2000
LONG-LIVED ASSETS:
United States $ 977,125 $ 819,200
Foreign countries 158,659 111,559
Total $ 1,135,784 $ 930,759
Assets attributed to foreign countries are based on the country in which those assets are located.