Starbucks 2001 Annual Report Download - page 7
Download and view the complete annual report
Please find page 7 of the 2001 Starbucks annual report below. You can navigate through the pages in the report by either clicking on the pages listed below, or by using the keyword search tool below to find specific information within the annual report.-
 1
1 -
 2
2 -
 3
3 -
 4
4 -
 5
5 -
 6
6 -
 7
7 -
 8
8 -
 9
9 -
 10
10 -
 11
11 -
 12
12 -
 13
13 -
 14
14 -
 15
15 -
 16
16 -
 17
17 -
 18
18 -
19
-
20
-
21
-
22
-
23
-
24
-
25
-
26
-
27
-
28
-
29
-
30
-
31
-
32
-
33
-
34
-
35
-
36
 |
 |

Fiscal 2001 Annual Report 23
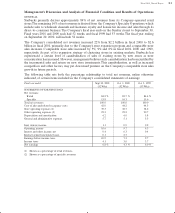
Depreciation and amortization was 6.2% of net revenues, compared to 6.0% of net revenues for fiscal
2000 primarily due to the Company’s international retail expansion.
General and administrative expenses were 5.7% of net revenues during fiscal 2001, compared to 5.1%
for fiscal 2000 primarily due to higher payroll-related expenditures, increased professional fees, non-
insured expenses recorded during the second fiscal quarter resulting from the Nisqually earthquake,
higher charitable contributions and provisions for obsolete software.
Joint Venture Income
The Company has two joint ventures to produce and distribute Starbucks branded products. The
North American Coffee Partnership is a 50/ 50 joint venture partnership with the Pepsi-Cola
Company to develop and distribute bottled Frappuccino®coffee drink. The Starbucks Ice Cream
Partnership is a 50/ 50 joint venture partnership with Dreyer’s Grand Ice Cream, Inc. to develop and
distribute premium ice creams.
The Company is a partner in several other joint ventures that operate licensed Starbucks retail stores,
including Starbucks Coffee Japan, Ltd., a 50/ 50 joint venture partnership with Japanese retailer and
restauranteur SAZABY Inc. to develop Starbucks retail stores in Japan, and Starbucks Coffee Korea
Co., Ltd., a 50/50 joint venture partnership with Shinsegae Department Store Co., Ltd., to develop
retail stores in the Republic of Korea. See separate “Subsequent Events” discussion for additional
information pertaining to Starbucks Coffee Japan, Ltd.
Joint venture income was $28.6 million for fiscal 2001, compared to $20.3 million for fiscal 2000.The
increase was primarily due to the improved profitability of the North American Coffee Partnership
as a result of increased sales volume from extension of its product line and expansion of geographic
distribution,as well as improvements in cost of goods sold primarily due to manufacturing efficiencies.
The increase was also due to improved operating results of Starbucks Coffee Japan, Ltd., attributable
to additional profitable store locations as well as the distribution of infrastructure and administrative
costs over an expanded revenue base. Starbucks Coffee Japan,Ltd. had 289 stores open as of September
30, 2001, compared to 154 stores open as of October 1, 2000.
Internet-related Investment Losses
During fiscal 2001, the Company determined that its investments in Internet-related companies had
suffered declines in value.The Company’s management deemed these declines as other than temporary
due to the sustained weak conditions in the Internet industry as reflected in the bankruptcy or
liquidation proceedings of numerous comparable companies and the significant decline in stock
market valuation of the sector, the declining financial condition of each company in which the
Company had invested,the unfavorable prospects of such companies obtaining additional funding and
the length of time and extent to which the quoted market values had been less than cost for publicly
traded companies. As a result, the Company recognized losses totaling $2.9 million to write off the
Company’s remaining investment in Kozmo.com, which was liquidated during fiscal 2001, and to
reduce its investment in Liveworld, Inc. (previously known as Talk City, Inc.).
As of September 30, 2001, the Company had Internet-related investments with an aggregate fair value of
$1.7 million.The Company plans to maintain its ownership of its remaining Internet-related investments
and will continue to record them at their fair value.The Company intends to focus its future investment
activity on its core businesses and other new business opportunities related to its core businesses.
Income Taxes
The Company’s effective tax rates of 37.3% in fiscal 2001 and 41.1% in fiscal 2000 were both impacted
by the establishment of valuation allowances against deferred tax benefits resulting from Internet-
related investment losses. Management determined that a portion of these losses may not be realizable
for tax purposes within the allowable carryforward period. Excluding the impact of these allowances,
the effective tax rates would have been 37.0% and 37.6% in fiscal 2001 and 2000, respectively.The
decrease to 37.0% in fiscal 2001 from 37.6% in fiscal 2000 was due to tax planning efforts.The effective
tax rate is expected to be 37.0% for fiscal 2002.
RESULTS OF OPERATIONS—FISCAL 2000 COMPARED TO FISCAL 1999
Systemwide R etail Store Sales
Systemwide retail store sales were $2.3 billion for fiscal 2000 (52 weeks), an increase of 38% from $1.6
billion in fiscal 1999 (53 weeks), primarily due to the opening of an additional 1,035 stores.