Starbucks 2001 Annual Report Download - page 5
Download and view the complete annual report
Please find page 5 of the 2001 Starbucks annual report below. You can navigate through the pages in the report by either clicking on the pages listed below, or by using the keyword search tool below to find specific information within the annual report.-
 1
1 -
 2
2 -
 3
3 -
 4
4 -
 5
5 -
 6
6 -
 7
7 -
 8
8 -
 9
9 -
 10
10 -
 11
11 -
 12
12 -
 13
13 -
 14
14 -
 15
15 -
 16
16 -
17
-
18
-
19
-
20
-
21
-
22
-
23
-
24
-
25
-
26
-
27
-
28
-
29
-
30
-
31
-
32
-
33
-
34
-
35
-
36
 |
 |

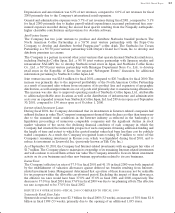
Fiscal 2001 Annual Report 21
Management’s Discussion and Analysis of Financial Condition and Results of Operations
GENERAL
Starbucks presently derives approximately 84% of net revenues from its Company-operated retail
stores.The remaining 16% of net revenues is derived from the Company’s Specialty Operations,which
include sales to wholesale channels and licensees, royalty and license fee income and sales through its
direct-to-consumer business.The Company’s fiscal year ends on the Sunday closest to September 30.
Fiscal years 2001 and 2000 each had 52 weeks, and fiscal 1999 had 53 weeks.The fiscal year ending
on September 29, 2002, will include 52 weeks.
The Company’s consolidated net revenues increased 22% from $2.2 billion in fiscal 2000 to $2.6
billion in fiscal 2001, primarily due to the Company’s store expansion program and comparable store
sales increases. Comparable store sales increased by 5%, 9% and 6% in fiscal 2001, 2000 and 1999,
respectively. As part of its expansion strategy of clustering stores in existing markets, Starbucks has
experienced a certain level of cannibalization of sales of existing stores by new stores as store
concentration has increased.However, management believes such cannibalization has been justified by
the incremental sales and return on new store investments.This cannibalization, as well as increased
competition and other factors, may put downward pressure on the Company’s comparable store sales
growth in future periods.
The following table sets forth the percentage relationship to total net revenues, unless otherwise
indicated, of certain items included in the Company’s consolidated statements of earnings:
Fiscal year ended Sept 30, 2001 Oct 1, 2000 Oct 3, 1999
(52 Wks) (52 Wks) (53 Wks)
STATEMENTS OF EARNINGS DATA
Net revenues:
Retail 84.2 % 83.7 % 84.4 %
Specialty 15.8 16.3 15.6
Total net revenues 100.0 100.0 100.0
Cost of sales and related occupancy costs 42.0 44.2 44.3
Store operating expenses (1) 39.3 38.7 38.2
Other operating expenses (2) 22.3 22.2 20.7
Depreciation and amortization 6.2 6.0 5.8
General and administrative expenses 5.7 5.1 5.3
Joint venture income 1.1 0.9 0.2
Operating income 10.6 9.7 9.3
Interest and other income, net 0.4 0.3 0.4
Internet-related investment losses 0.1 2.7 -
Earnings before income taxes 10.9 7.3 9.7
Income taxes 4.1 3.0 3.7
Net earnings 6.8 % 4.3 % 6.0 %
(1) Shown as a percentage of retail revenues.
(2) Shown as a percentage of specialty revenues.