Starbucks 2011 Annual Report Download - page 66
Download and view the complete annual report
Please find page 66 of the 2011 Starbucks annual report below. You can navigate through the pages in the report by either clicking on the pages listed below, or by using the keyword search tool below to find specific information within the annual report.-
 1
1 -
2
-
3
-
4
-
5
-
6
-
7
-
8
-
9
-
10
-
11
-
12
-
13
-
14
-
15
-
16
-
17
-
18
-
19
-
20
-
21
-
22
-
23
-
24
-
25
-
26
-
27
-
28
-
29
-
30
-
31
-
32
-
33
-
34
-
35
-
36
-
37
-
38
-
39
-
40
-
41
-
42
-
43
-
44
-
45
-
46
-
47
-
48
-
49
-
50
-
51
-
52
-
53
-
54
-
55
-
 56
56 -
 57
57 -
 58
58 -
 59
59 -
 60
60 -
 61
61 -
 62
62 -
 63
63 -
 64
64 -
 65
65 -
 66
66 -
 67
67 -
 68
68 -
 69
69 -
 70
70 -
 71
71 -
 72
72 -
 73
73 -
 74
74 -
 75
75 -
 76
76 -
77
-
78
-
79
-
80
-
81
-
82
-
83
-
84
-
85
-
86
-
87
-
88
-
89
-
90
-
91
-
92
-
93
-
94
-
95
-
96
-
97
-
98
 |
 |

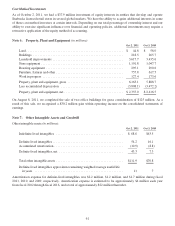
date at which the base “C” coffee commodity price component will be fixed has not yet been established. For these
types of contracts, either Starbucks or the seller has the option to “fix” the base “C” coffee commodity price prior to
the delivery date. Until prices are fixed, we estimate the total cost of these purchase commitments. We believe,
based on relationships established with our suppliers in the past, the risk of non-delivery on such purchase
commitments is remote.
Note 5: Equity and Cost Investments (in millions)
Oct 2, 2011 Oct 3, 2010
Equitymethodinvestments ......................................... $334.4 $308.1
Costmethodinvestments ........................................... 37.9 33.4
Total .......................................................... $372.3 $341.5
Equity Method Investments
As of October 2, 2011, we had a 50 percent ownership interest in each of the following international equity
investees: Starbucks Coffee Korea Co., Ltd.; President Starbucks Coffee Taiwan Ltd.; Shanghai President Coffee
Co.; and Berjaya Starbucks Coffee Company Sdn. Bhd. (Malaysia). In addition, we had a 39.8 percent ownership
interest in Starbucks Coffee Japan, Ltd. These international entities operate licensed Starbucks retail stores. We also
have licensed the rights to produce and distribute Starbucks branded products to The North American Coffee
Partnership with the Pepsi-Cola Company. We have a 50 percent ownership interest in The North America Coffee
Partnership, which develops and distributes bottled Frappuccino®beverages, Starbucks DoubleShot®espresso
drinks, and Seattle’s Best Coffee®ready-to-drink espresso beverages.
Our share of income and losses from our equity method investments is included in income from equity investees on
the consolidated statements of earnings. Also included in this line item is our proportionate share of gross margin
resulting from coffee and other product sales to, and royalty and license fee revenues generated from, equity
investees. Revenues generated from these related parties, net of eliminations, were $151.6 million, $125.7 million,
and $125.3 million in fiscal years 2011, 2010, and 2009, respectively. Related costs of sales, net of eliminations,
were $83.2 million, $65.3 million, and $64.9 million in fiscal years 2011, 2010, and 2009, respectively. As of
October 2, 2011 and October 3, 2010, there were $31.9 million and $31.4 million of accounts receivable from equity
investees, respectively, on our consolidated balance sheets, primarily related to product sales and store license fees.
As of October 2, 2011, the aggregate market value of our investment in Starbucks Japan was approximately
$334 million, determined based on its available quoted market price, which exceeds its carrying value of $182
million.
Summarized combined financial information of our equity method investees, which represent 100% of the
investees’ financial information (in millions):
Financial Position as of Oct 2, 2011 Oct 3, 2010
Current assets .................................................... $476.9 $390.1
Noncurrent assets ................................................. 651.4 570.3
Current liabilities ................................................. 340.1 260.6
Noncurrent liabilities .............................................. 80.2 70.5
Results of Operations for Fiscal Year Ended Oct 2, 2011 Oct 3, 2010 Sep 27, 2009
Netrevenues ......................................... $2,395.1 $2,128.0 $2,100.1
Operatingincome ..................................... 277.0 245.3 192.5
Netearnings ......................................... 231.1 205.1 155.8
60