Starbucks 2011 Annual Report Download - page 67
Download and view the complete annual report
Please find page 67 of the 2011 Starbucks annual report below. You can navigate through the pages in the report by either clicking on the pages listed below, or by using the keyword search tool below to find specific information within the annual report.-
 1
1 -
2
-
3
-
4
-
5
-
6
-
7
-
8
-
9
-
10
-
11
-
12
-
13
-
14
-
15
-
16
-
17
-
18
-
19
-
20
-
21
-
22
-
23
-
24
-
25
-
26
-
27
-
28
-
29
-
30
-
31
-
32
-
33
-
34
-
35
-
36
-
37
-
38
-
39
-
40
-
41
-
42
-
43
-
44
-
45
-
46
-
47
-
48
-
49
-
50
-
51
-
52
-
53
-
54
-
55
-
56
-
 57
57 -
 58
58 -
 59
59 -
 60
60 -
 61
61 -
 62
62 -
 63
63 -
 64
64 -
 65
65 -
 66
66 -
 67
67 -
 68
68 -
 69
69 -
 70
70 -
 71
71 -
 72
72 -
 73
73 -
 74
74 -
 75
75 -
 76
76 -
 77
77 -
78
-
79
-
80
-
81
-
82
-
83
-
84
-
85
-
86
-
87
-
88
-
89
-
90
-
91
-
92
-
93
-
94
-
95
-
96
-
97
-
98
 |
 |

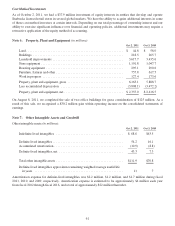
Cost Method Investments
As of October 2, 2011, we had a $37.9 million investment of equity interests in entities that develop and operate
Starbucks licensed retail stores in several global markets. We have the ability to acquire additional interests in some
of these cost method investees at certain intervals. Depending on our total percentage of ownership interest and our
ability to exercise significant influence over financial and operating policies, additional investments may require a
retroactive application of the equity method of accounting.
Note 6: Property, Plant and Equipment (in millions)
Oct 2, 2011 Oct 3, 2010
Land........................................................... $ 44.8 $ 58.0
Buildings ....................................................... 218.5 265.7
Leasehold improvements ........................................... 3,617.7 3,435.6
Storeequipment.................................................. 1,101.8 1,047.7
Roastingequipment ............................................... 295.1 290.6
Furniture,fixturesandother......................................... 757.8 617.5
Workinprogress ................................................. 127.4 173.6
Property,plantandequipment,gross .................................. 6,163.1 5,888.7
Less accumulated depreciation ...................................... (3,808.1) (3,472.2)
Property,plantandequipment,net.................................... $2,355.0 $ 2,416.5
On August 8, 2011, we completed the sale of two office buildings for gross consideration of $125 million. As a
result of this sale, we recognized a $30.2 million gain within operating income on the consolidated statements of
earnings.
Note 7: Other Intangible Assets and Goodwill
Other intangible assets (in millions):
Oct 2, 2011 Oct 3, 2010
Indefinite-lived intangibles ......................................... $ 68.6 $63.5
Definite-lived intangibles ........................................... 54.2 16.1
Accumulatedamortization .......................................... (10.9) (8.8)
Definite-lived intangibles, net ....................................... 43.3 7.3
Total other intangible assets ......................................... $111.9 $70.8
Definite-lived intangibles approximate remaining weighted average useful life
inyears ...................................................... 11 7
Amortization expense for definite-lived intangibles was $2.2 million, $1.2 million, and $1.7 million during fiscal
2011, 2010, and 2009, respectively. Amortization expense is estimated to be approximately $4 million each year
from fiscal 2012 through fiscal 2016, and a total of approximately $22 million thereafter.
61