Starbucks 2011 Annual Report Download - page 80
Download and view the complete annual report
Please find page 80 of the 2011 Starbucks annual report below. You can navigate through the pages in the report by either clicking on the pages listed below, or by using the keyword search tool below to find specific information within the annual report.-
 1
1 -
2
-
3
-
4
-
5
-
6
-
7
-
8
-
9
-
10
-
11
-
12
-
13
-
14
-
15
-
16
-
17
-
18
-
19
-
20
-
21
-
22
-
23
-
24
-
25
-
26
-
27
-
28
-
29
-
30
-
31
-
32
-
33
-
34
-
35
-
36
-
37
-
38
-
39
-
40
-
41
-
42
-
43
-
44
-
45
-
46
-
47
-
48
-
49
-
50
-
51
-
52
-
53
-
54
-
55
-
56
-
57
-
58
-
59
-
60
-
61
-
62
-
63
-
64
-
65
-
66
-
67
-
68
-
69
-
 70
70 -
 71
71 -
 72
72 -
 73
73 -
 74
74 -
 75
75 -
 76
76 -
 77
77 -
 78
78 -
 79
79 -
 80
80 -
 81
81 -
 82
82 -
 83
83 -
 84
84 -
 85
85 -
 86
86 -
 87
87 -
 88
88 -
 89
89 -
 90
90 -
91
-
92
-
93
-
94
-
95
-
96
-
97
-
98
 |
 |

previous equity investment to fair value, resulting in a gain of approximately $55 million which was included in net
interest income and other on our consolidated statements of earnings. The fair value of 100% of the net assets of
these markets on the acquisition date was $131.0 million and was recorded on our consolidated balance sheets.
Included in these net assets were $63.8 million of goodwill and $35.1 million in definite-lived intangible assets.
In the third quarter of fiscal 2011, we acquired the remaining 30% ownership of our business in the southern portion
of China from our noncontrolling partner, Maxim’s Caterers Limited (Maxim’s). We simultaneously sold our 5%
ownership interest in the Hong Kong market to Maxim’s.
In the first quarter of fiscal 2010, we acquired 100% ownership of our business in France, converting it from a 50%
joint venture with Sigla S.A. (Grupo Vips) of Spain to a company-operated market. We simultaneously sold our
50% ownership interests in the Spain and Portugal markets to Grupo Vips, converting them to licensed markets.
In the fourth quarter of fiscal 2010, we acquired 100% ownership of our business in Brazil, converting it from a 49%
joint venture with Cafés Sereia do Brasil Participações S.A of Brazil to a company-operated market.
In the fourth quarter of fiscal 2010, we acquired 100% ownership of a previously consolidated 50% joint venture in
the US with Johnson Coffee Corporation, Urban Coffee Opportunities (“UCO”).
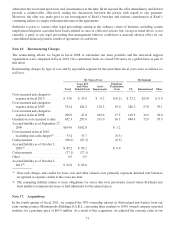
The following table shows the effects of the change in Starbucks ownership interest in UCO and our business in
South China on Starbucks equity:
Fiscal Year Ended Oct 2, 2011 Oct 3, 2010 Sep 27, 2009
Net earnings attributable to Starbucks .............................. $1,245.7 $945.6 $390.8
Transfers (to) from the noncontrolling interest:
Decrease in additional paid-in capital for purchase of interest in
subsidiary ............................................. (28.0) (26.8) 0.0
Change from net earnings attributable to Starbucks and transfers to
noncontrolling interest ....................................... $1,217.7 $918.8 $390.8
Note 18: Segment Reporting
Segment information is prepared on the same basis that our management reviews financial information for
operational decision making purposes. We have three reportable operating segments: US, International, and CPG.
Our Seattle’s Best Coffee operating segment is reported with our unallocated corporate expenses and Digital
Ventures in “Other”.
United States
US operations sell coffee and other beverages, complementary food, whole bean coffees, and a focused selection of
merchandise primarily through company-operated stores. Other operations within the US include licensed stores.
International
International operations sell coffee and other beverages, complementary food, whole bean coffees, and a focused
selection of merchandise through company-operated stores in Canada, the UK, and several other markets. Other
operations in international markets primarily include retail store licensing operations in nearly 50 countries and
foodservice accounts, primarily in the UK and Canada. Many of our international operations are in the early stages
of development that require a more extensive support organization, relative to the current levels of revenue and
operating income, than in the US.
74