Symantec 2008 Annual Report Download - page 7
Download and view the complete annual report
Please find page 7 of the 2008 Symantec annual report below. You can navigate through the pages in the report by either clicking on the pages listed below, or by using the keyword search tool below to find specific information within the annual report.-
 1
1 -
 2
2 -
 3
3 -
 4
4 -
 5
5 -
 6
6 -
 7
7 -
 8
8 -
 9
9 -
 10
10 -
 11
11 -
 12
12 -
 13
13 -
 14
14 -
 15
15 -
 16
16 -
 17
17 -
 18
18 -
19
-
20
-
21
-
22
-
23
-
24
-
25
-
26
-
27
-
28
-
29
-
30
-
31
-
32
-
33
-
34
-
35
-
36
-
37
-
38
-
39
-
40
-
41
-
42
-
43
-
44
-
45
-
46
-
47
-
48
-
49
-
50
-
51
-
52
-
53
-
54
-
55
-
56
-
57
-
58
-
59
-
60
-
61
-
62
-
63
-
64
-
65
-
66
-
67
-
68
-
69
-
70
-
71
-
72
-
73
-
74
-
75
-
76
-
77
-
78
-
79
-
80
-
81
-
82
-
83
-
84
-
85
-
86
-
87
-
88
-
89
-
90
-
91
-
92
-
93
-
94
-
95
-
96
-
97
-
98
-
99
-
100
-
101
-
102
-
103
-
104
-
105
-
106
-
107
-
108
-
109
-
110
-
111
-
112
-
113
-
114
-
115
-
116
-
117
-
118
-
119
-
120
-
121
-
122
-
123
-
124
-
125
-
126
-
127
-
128
-
129
-
130
-
131
-
132
-
133
-
134
-
135
-
136
-
137
-
138
-
139
-
140
-
141
-
142
-
143
-
144
-
145
-
146
-
147
-
148
-
149
-
150
-
151
-
152
-
153
-
154
-
155
-
156
-
157
-
158
-
159
-
160
-
161
-
162
-
163
-
164
-
165
-
166
-
167
-
168
-
169
-
170
-
171
-
172
-
173
-
174
-
175
-
176
-
177
-
178
-
179
-
180
-
181
-
182
-
183
-
184
-
185
-
186
-
187
-
188
-
189
-
190
-
191
-
192
-
193
-
194
-
195
-
196
-
197
-
198
-
199
-
200
 |
 |

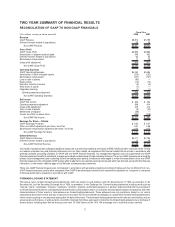
TWO YEAR SUMMARY OF FINANCIAL RESULTS
RECONCILIATION OF GAAP TO NON-GAAP FINANCIALS
($ in millions, except per share amounts) 2008 2007
Fiscal Year
Revenue
GAAP Revenue $5,874 $5,199
Deferred revenue related to acquisitions 63 53
Non-GAAP Revenue $5,937 $5,253
Gross Profit
GAAP Gross Profit $4,654 $3,984
Amortization of acquired product rights 349 342
Deferred revenue related to acquisitions 63 53
Stock-based compensation 17 16
Gross profit adjustment 429 412
Non-GAAP Gross Profit $5,083 $4,396
Operating Expenses
GAAP Operating Expenses $4,052 $3,464
Amortization of other intangible assets (225) (202)
Stock-based compensation (147) (137)
Loss on sale of assets (95) —
Restructuring (74) (70)
Executive incentive bonuses (3) (4)
Write-down of assets (1) —
Integration planning (1) (1)
Operating expenses adjustment 546 414
Non-GAAP Operating Expenses $3,506 $3,050
Net Income
GAAP Net Income $ 464 $ 404
Operating expenses adjustment 546 414
Gross profit adjustment 429 412
Gain on sale of assets (3) (20)
Settlements of litigation (59) —
Income tax effect on above items (250) (218)
Non-GAAP Net Income $1,127 $ 992
Earnings Per Share — Diluted
GAAP Earnings Per Share $ 0.52 $ 0.41
Other non-GAAP adjustments per share, net of tax 0.61 0.48
Stock-based compensation adjustment per share, net of tax 0.14 0.12
Non-GAAP Earnings Per Share $ 1.27 $ 1.01
Deferred Revenue
GAAP Deferred Revenue $3,077 $2,754
Deferred revenue related to acquisitions 12 18
Non-GAAP Deferred Revenue $3,088 $2,772
Our results of operations have undergone significant change due to a series of acquisitions, the impact of SFAS 123(R) and other corporate events. To help
our readers understand our past financial performance and our future results, we supplement the financial results that we provide in accordance with
generally accepted accounting principles, or GAAP, with non-GAAP financial measures. Our management regularly uses our supplemental non-GAAP
financial measures internally to understand, manage and evaluate our business and make operating decisions. These non-GAAP measures are among the
primary factors management uses in planning for and forecasting future periods. Investors are encouraged to review the reconciliation of our non-GAAP
financial measures to the comparable GAAP results, which is attached to our quarterly earnings release and which can be found, along with other financial
information, on the investor relations page of our Web site at www.symantec.com/invest.
These non-GAAP financial measures are not prepared in accordance with generally accepted accounting principles and may be different from non-
GAAP financial measures used by other companies. Non-GAAP financial measures should not be considered a substitute for, or superior to, measures
of financial performance prepared in accordance with GAAP.
FORWARD-LOOKING STATEMENT
This annual report contains forward-looking statements, which are subject to safe harbors under the Securities Act of 1933, as amended, or the
Securities Act, and the Securities Exchange Act of 1934, as amended, or the Exchange Act. Forward-looking statements including words such as
“expects,” “plans,” “anticipates,” “believes,” “estimates,” “predicts,” “projects,” and similar expressions. In addition, statements that refer to projections of
our future financial performance, anticipated growth and trends in our businesses and in our industries, the anticipated impacts of acquisitions, and other
characterizations of future events or circumstances are forward-looking statements. These statements are only predictions, based on our current
expectations about future events and may not prove to be accurate. We do not undertake any obligation to update these forward-looking statements to
reflect events occurring or circumstances arising after the date of this report. These forward-looking statements involve risks and uncertainties, and our
actual results, performance, or achievements could differ materially from those expressed or implied by the forward-looking statements on the basisof
several factors, including those that we discuss under Item 1A, Risk Factors of the 10-K. We encourage you to read that section carefully.
5