Walgreens 2007 Annual Report Download - page 22
Download and view the complete annual report
Please find page 22 of the 2007 Walgreens annual report below. You can navigate through the pages in the report by either clicking on the pages listed below, or by using the keyword search tool below to find specific information within the annual report.-
 1
1 -
2
-
3
-
4
-
5
-
6
-
7
-
8
-
9
-
10
-
11
-
 12
12 -
 13
13 -
 14
14 -
 15
15 -
 16
16 -
 17
17 -
 18
18 -
 19
19 -
 20
20 -
 21
21 -
 22
22 -
 23
23 -
 24
24 -
 25
25 -
 26
26 -
 27
27 -
 28
28 -
 29
29 -
 30
30 -
 31
31 -
 32
32 -
33
-
34
-
35
-
36
-
37
-
38
-
39
-
40
 |
 |

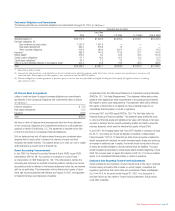
Management’s Discussion and Analysis of Results of Operations
and Financial Condition
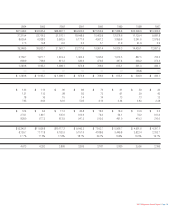
Percent to Net Sales
Fiscal Year 2007 2006 2005
Gross Margin 28.4 27.8 27.9
Selling, Occupancy and
Administration Expenses 22.5 22.1 22.2
Other Statistics
Fiscal Year 2007 2006 2005
Prescription Sales as a % of Net Sales 65.0 64.3 63.7
Third Party Sales as a % of Total
Prescription Sales 94.8 93.1 92.7
Total Number of Prescriptions (In Millions) 583.4 530.0 489.4
Total Number of Locations
(1)
5,997 5,461 4,985
(1) The total number of locations for fiscal year 2005 has been adjusted to include
home care locations for consistency.
Results of Operations
Fiscal 2007 was our 33rd consecutive year of record sales and earnings. Fiscal
year net earnings increased 16.6% to $2.041 billion, or $2.03 per share (diluted),
versus last year’s earnings of $1.751 billion, or $1.72 per share (diluted). Net
earnings increases resulted from improved sales and higher gross margins, partially
offset by higher expense ratios.
Fiscal 2007 included insignificant pre-tax litigation settlement gains. There were
pre-tax litigation settlement gains of $7.3 million (less than $.01 per share, diluted)
in fiscal 2006 and $26.3 million ($.02 per share, diluted) in fiscal 2005. Fiscal
2006 included a $12.3 million (less than $.01 per share, diluted) downward
adjustment of the fiscal 2005 pre-tax expenses of $54.7 million ($.03 per share,
diluted) related to Hurricane Katrina.
Net sales increased by 13.4% to $53.762 billion in fiscal 2007 compared to
increases of 12.3% in 2006 and 12.5% in 2005. Drugstore sales increases resulted
from sales gains in existing stores and added sales from new stores, each of
which includes an indeterminate amount of market-driven price changes. Sales in
comparable drugstores were up 8.1% in 2007, 7.7% in 2006 and 8.2% in 2005.
Comparable drugstores are defined as those that have been open for at least
twelve consecutive months without closure for seven or more consecutive days
and without a major remodel or a natural disaster in the past twelve months.
Relocated and acquired stores are not included as comparable stores for the
first twelve months after the relocation or acquisition. We operated 5,997
locations at August 31, 2007, compared to 5,461 at August 31, 2006, and
4,985 at August 31, 2005.
Prescription sales increased 14.7% in 2007, 13.3% in 2006 and 13.4% in 2005.
Comparable drugstore prescription sales were up 9.5% in 2007, 9.2% in 2006
and 9.8% in 2005. Prescription sales were 65.0% of total net sales for fiscal 2007
compared to 64.3% in 2006 and 63.7% in 2005. The effect of generic drugs
introduced during the fiscal year, which replaced higher priced retail brand name
drugs, reduced prescription sales by 4.2% for 2007, 2.0% for 2006 and 2.4% for
2005 while the effect on total sales was 2.5% for 2007, 1.2% for 2006 and 1.4%
for 2005. Third party sales, where reimbursement is received from managed care
organizations, the government or private insurers, were 94.8% of prescription sales
in 2007, 93.1% in 2006 and 92.7% in 2005. The total number of prescriptions
filled was approximately 583.4 million in 2007; 530.0 million in 2006 and
489.4 million in 2005.
Introduction
Walgreens is principally a retail drugstore chain that sells prescription and non-
prescription drugs and general merchandise. General merchandise includes,
among other things, beauty care, personal care, household items, candy, photofin-
ishing, greeting cards, seasonal items and convenience food. Customers can
have prescriptions filled at the drugstore counter, as well as through the mail,
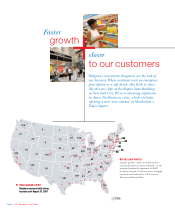
by telephone and via the Internet. As of August 31, 2007, we operated 5,997
locations (including three mail service facilities, 101 home care facilities and eight
specialty pharmacies) located in 48 states and Puerto Rico. The total location
count of 5,997 does not include the 62 convenient care clinics operated by
Take Care Health Systems, Inc.
The drugstore industry is highly competitive. In addition to other drugstore chains,
independent drugstores and mail order prescription providers, we also compete
with various other retailers including grocery stores, convenience stores, mass
merchants and dollar stores.
Prescription sales continue to become a larger portion of the company’s business.
The long-term outlook for prescription sales is strong due in part to the aging
population, the introduction of lower priced generics and the continued develop-
ment of innovative drugs that improve quality of life and control healthcare costs.
Certain provisions relating to Medicaid reimbursement rates for generic drugs from
the Deficit Reduction Act of 2005 become effective during fiscal 2008 and are
expected to reduce our reimbursement.
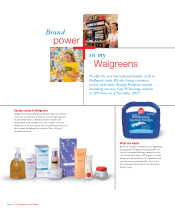
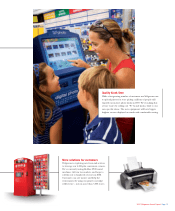
Front-end sales have continued to grow due to strengthening core categories,
such as over-the-counter non-prescription drugs, beauty care and personal care
products. Walgreens strong name recognition continues to drive private brand
sales, which are included in these core categories.
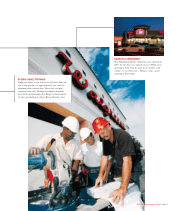
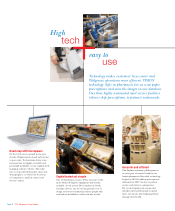
We continue to expand into new markets and increase penetration in existing
markets. To support our growth, we are investing significantly in prime locations,
technology and customer service initiatives. Retail organic growth continues to be
our primary growth vehicle; however, consideration is given to acquisitions that
provide a unique opportunity and strategic fit for our business. Fiscal 2007 acquisi-
tions included Option Care, Inc. and affiliated companies, a specialty pharmacy
and home infusion services provider; Take Care Health Systems, Inc. and LLC,
a convenient care clinic operator; selected assets from Familymeds Group, Inc.,
a pharmacy chain; the remaining minority interest in SeniorMed LLC and selected
other assets (primarily prescription files).
Operating Statistics
Percentage Increases
Fiscal Year 2007 2006 2005
Net Sales 13.4 12.3 12.5
Net Earnings 16.6 12.3 15.5
Comparable Drugstore Sales 8.1 7.7 8.2
Prescription Sales 14.7 13.3 13.4
Comparable Drugstore Prescription Sales 9.5 9.2 9.8
Front-End Sales 12.2 10.9 11.1
Comparable Drugstore Front-End Sales 5.8 5.3 5.5
Page 20 2007 Walgreens Annual Report