Walgreens 2007 Annual Report Download - page 3
Download and view the complete annual report
Please find page 3 of the 2007 Walgreens annual report below. You can navigate through the pages in the report by either clicking on the pages listed below, or by using the keyword search tool below to find specific information within the annual report.-
 1
1 -
 2
2 -
 3
3 -
 4
4 -
 5
5 -
 6
6 -
 7
7 -
 8
8 -
 9
9 -
 10
10 -
 11
11 -
 12
12 -
 13
13 -
 14
14 -
15
-
16
-
17
-
18
-
19
-
20
-
21
-
22
-
23
-
24
-
25
-
26
-
27
-
28
-
29
-
30
-
31
-
32
-
33
-
34
-
35
-
36
-
37
-
38
-
39
-
40
 |
 |
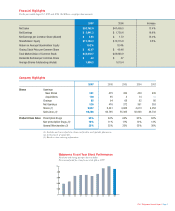
Financial Highlights
For the years ended August 31, 2007 and 2006 (In Millions, except per share amounts)
2007 2006 Increase
Net Sales $53,762.0 $47,409.0 13.4%
Net Earnings $ 2,041.3 $ 1,750.6 16.6%
Net Earnings per Common Share (diluted) $ 2.03 $ 1.72 18.0%
Shareholders’ Equity $11,104.3 $ 10,115.8 9.8%
Return on Average Shareholders’ Equity 19.2% 18.4%
Closing Stock Price per Common Share $ 45.07 $ 49.46
Total Market Value of Common Stock $44,670.7 $49,848.9
Dividends Declared per Common Share $ .33 $.27
Average Shares Outstanding (diluted) 1,006.3 1,019.4
2007 Walgreens Annual Report Page 1
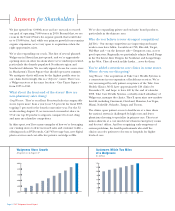
2007 2006 2005 2004 2003
Stores Openings
New Stores 501 475 436 429 439
Acquisitions 120 95 4 14 —
Closings 85 94 68 82 86
Net Openings 536 476 372 361 353
Stores
(1)
5,997 5,461 4,985 4,613 4,252
Sales Area
(2)
66,386 60,795 55,385 50,926 46,733
Product Class Sales Prescription Drugs 65% 64% 64% 63% 62%
Non-prescription Drugs
(3)
10% 11% 11% 12% 12%
General Merchandise
(3)
25% 25% 25% 25% 26%
(1) Includes mail service facilities, home care facilities and specialty pharmacies.
(2) In thousands of square feet.
(3) Based on store scanning information.
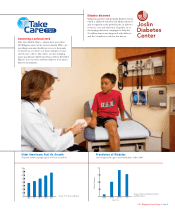
Company Highlights
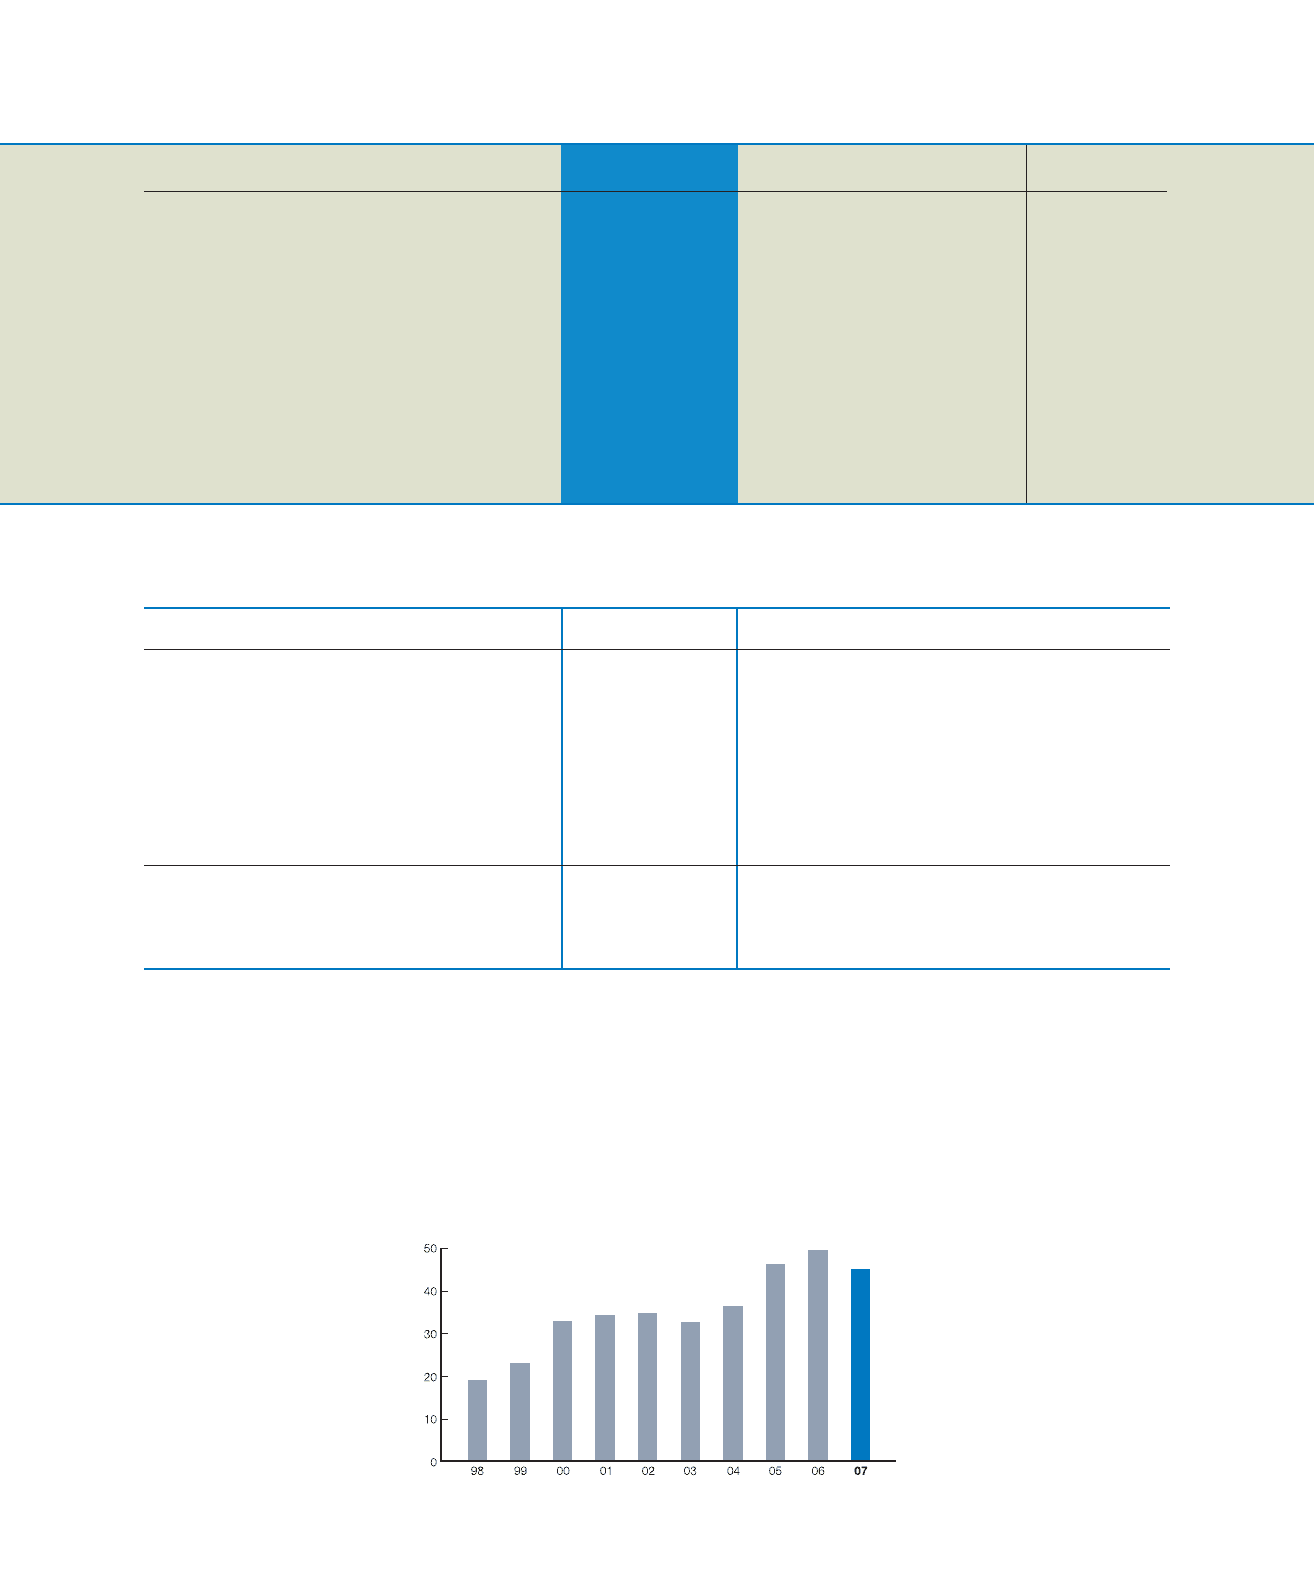
Walgreens Fiscal Year Stock Performance
Fiscal year-end closing price per share in dollars
Prices are adjusted for a two-for-one stock split in 1999