Walgreens 2007 Annual Report Download - page 36
Download and view the complete annual report
Please find page 36 of the 2007 Walgreens annual report below. You can navigate through the pages in the report by either clicking on the pages listed below, or by using the keyword search tool below to find specific information within the annual report.-
 1
1 -
2
-
3
-
4
-
5
-
6
-
7
-
8
-
9
-
10
-
11
-
12
-
13
-
14
-
15
-
16
-
17
-
18
-
19
-
20
-
21
-
22
-
23
-
24
-
25
-
 26
26 -
 27
27 -
 28
28 -
 29
29 -
 30
30 -
 31
31 -
 32
32 -
 33
33 -
 34
34 -
 35
35 -
 36
36 -
 37
37 -
 38
38 -
 39
39 -
 40
40
 |
 |
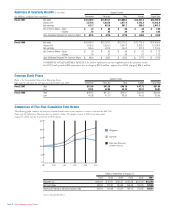
Summary of Quarterly Results (Unaudited) Quarter Ended
(In Millions, except per share amounts) November February May August Fiscal Year
Fiscal 2007 Net sales $12,708.5 $13,933.7 $13,698.3 $13,421.5 $53,762.0
Gross profit 3,575.6 4,035.8 3,877.2 3,755.3 15,243.9
Net earnings 431.7 651.9 561.2 396.5 2,041.3
Per Common Share – Basic $ .43 $ .65 $ .56 $ .40 $ 2.04
– Diluted .43 .65 .56 .40 2.03
Cash Dividends Declared Per Common Share $ .0775 $ .0775 $ .0775 $ .0950 $ .3275
Fiscal 2006 Net sales $10,900.4 $12,163.1 $12,175.2 $12,170.3 $ 47,409.0
Gross profit 3,002.5 3,459.3 3,343.2 3,363.6 13,168.6
Net earnings 345.6 523.5 469.2 412.3 1,750.6
Per Common Share – Basic $ .34 $ .52 $ .46 $ .41 $ 1.73
– Diluted .34 .51 .46 .41 1.72
Cash Dividends Declared Per Common Share $ .0650 $ .0650 $ .0650 $ .0775 $ .2725
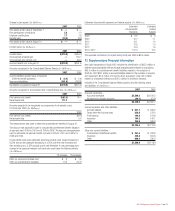
COMMENTS ON QUARTERLY RESULTS: In further explanation of and supplemental to the quarterly results,
the 2007 fourth quarter LIFO adjustment was a charge of $32.0 million compared to a 2006 charge of $26.1 million.
Common Stock Prices
Quarter Ended
Below is the Consolidated Transaction Reporting System
high and low sales price for each quarter of fiscal 2007 and 2006. November February May August Fiscal Year
Fiscal 2007 High $51.60 $47.28 $49.10 $47.72 $51.60
Low 39.91 40.05 43.23 43.31 39.91
Fiscal 2006 High $48.25 $47.05 $46.07 $50.00 $50.00
Low 40.98 42.13 39.55 40.45 39.55
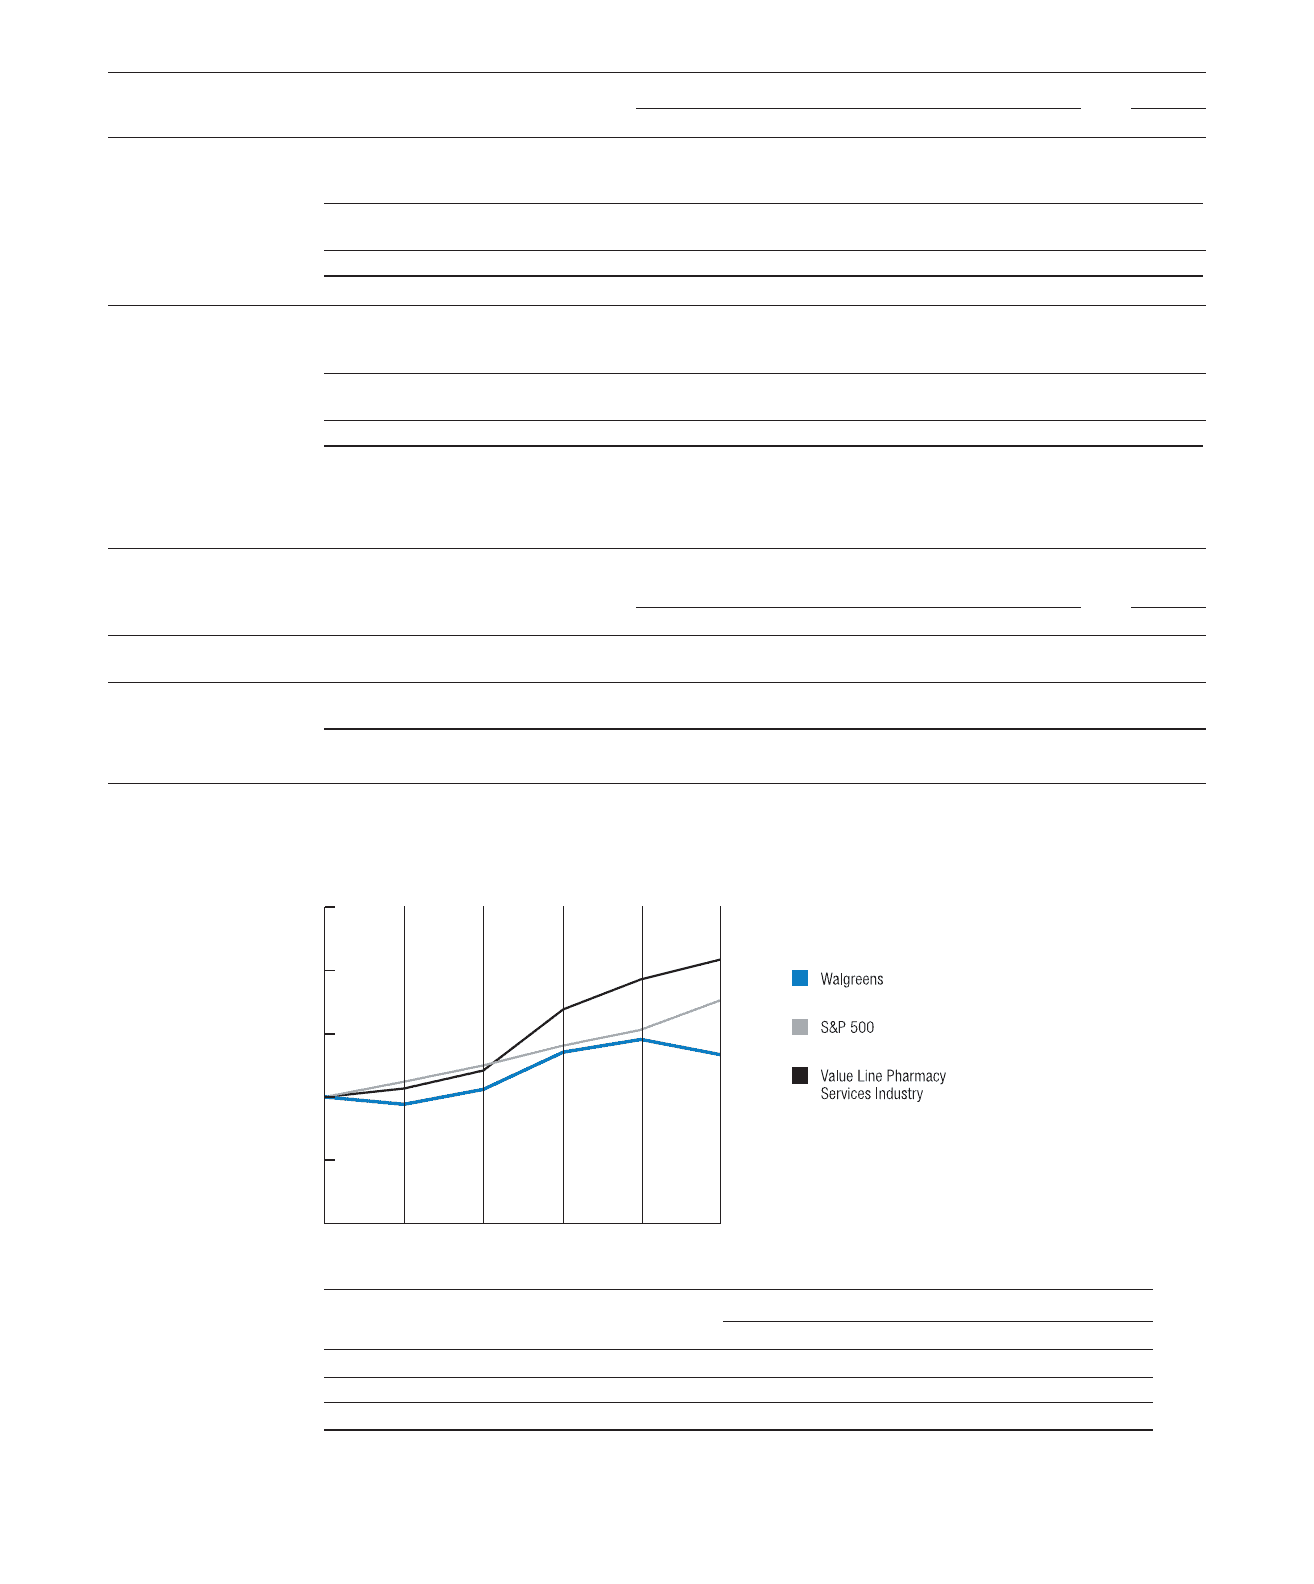
Value of Investment at August 31,
2002 2003 2004 2005 2006 2007
Walgreen Co. $100.00 $ 94.21 $105.97 $135.38 $145.40 $133.48
S&P 500 Index 100.00 112.07 124.90 140.59 153.08 176.25
Value Line Pharmacy Services Industry Index 100.00 106.68 120.87 169.15 192.86 208.44
Comparison of Five-Year Cumulative Total Return
The following graph compares the five-year cumulative total return of the company’s common stock with the S&P 500
Index and the Value Line Pharmacy Services Industry Index. The graph assumes a $100 investment made
August 31, 2002, and the reinvestment of all dividends.
Page 34 2007 Walgreens Annual Report
Source: Standard &Poor’s
8/03 8/04 8/05 8/06 8/07
8/02
0
50
100
150
200
250