Walgreens 2007 Annual Report Download - page 28
Download and view the complete annual report
Please find page 28 of the 2007 Walgreens annual report below. You can navigate through the pages in the report by either clicking on the pages listed below, or by using the keyword search tool below to find specific information within the annual report.-
 1
1 -
2
-
3
-
4
-
5
-
6
-
7
-
8
-
9
-
10
-
11
-
12
-
13
-
14
-
15
-
16
-
17
-
 18
18 -
 19
19 -
 20
20 -
 21
21 -
 22
22 -
 23
23 -
 24
24 -
 25
25 -
 26
26 -
 27
27 -
 28
28 -
 29
29 -
 30
30 -
 31
31 -
 32
32 -
 33
33 -
 34
34 -
 35
35 -
 36
36 -
 37
37 -
 38
38 -
39
-
40
 |
 |

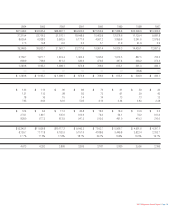
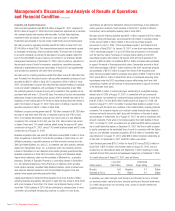
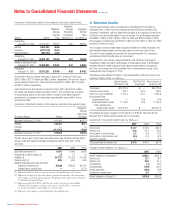
Consolidated Statements of Cash Flows
Walgreen Co. and Subsidiaries for the Years Ended August 31, 2007, 2006 and 2005 (In Millions)
2007 2006 2005
Cash Flows from Net earnings $ 2,041.3 $ 1,750.6 $ 1,559.5
Operating Activities Adjustments to reconcile net earnings to net
cash provided by operating activities –
Depreciation and amortization 675.9 572.2 482.1
Deferred income taxes 23.2 (104.0) (70.8)
Stock compensation expense 74.2 102.5 —
Income tax savings from employee stock plans 6.1 8.1 33.9
Other 3.3 (19.3) (6.7)
Changes in operating assets and liabilities –
Inventories (676.2) (375.7) (854.0)
Trade accounts payable (128.3) 875.6 276.7
Accounts receivable, net (40.4) (618.5) (224.9)
Accrued expenses and other liabilities 276.9 204.5 105.3
Other assets (28.9) (8.5) (78.1)
Other non-current liabilities 104.3 120.5 143.2
Income taxes 25.3 (68.4) 5.0
Net cash provided by operating activities 2,356.7 2,439.6 1,371.2
Cash Flows from Purchases of short-term investments
Investing Activities – available for sale (6,396.9) (12,282.4) (10,742.0)
Proceeds from sale of short-term investments
– available for sale 6,826.0 12,388.4 11,519.9
Additions to property and equipment (1,785.3) (1,337.8) (1,237.5)
Proceeds from sale of assets 40.8 23.0 15.5
Business and intangible asset acquisitions,
net of cash received (1,085.8) (485.4) —
Net proceeds from corporate-owned life insurance policies 5.5 10.7 10.1
Net cash used for investing activities (2,395.7) (1,683.5) (434.0)
Cash Flows from Net proceeds from short-term borrowings 850.0 ——
Financing Activities Payments of debt (141.2) ——
Stock purchases (1,063.5) (668.8) (781.8)
Proceeds related to employee stock plans 266.1 319.1 177.5
Cash dividends paid (310.2) (262.9) (214.5)
Bank overdrafts (213.9) 213.9 —
Other (13.4) (14.3) 14.4
Net cash used for financing activities (626.1) (413.0) (804.4)
Changes in Cash and Net increase (decrease) in cash and cash equivalents (665.1) 343.1 132.8
Cash Equivalents Cash and cash equivalents at beginning of year 919.9 576.8 444.0
Cash and cash equivalents at end of year $ 254.8 $ 919.9 $ 576.8
The accompanying Notes to Consolidated Financial Statements are integral parts of these statements.
Page 26 2007 Walgreens Annual Report