Walgreens 2007 Annual Report Download - page 24
Download and view the complete annual report
Please find page 24 of the 2007 Walgreens annual report below. You can navigate through the pages in the report by either clicking on the pages listed below, or by using the keyword search tool below to find specific information within the annual report.-
 1
1 -
2
-
3
-
4
-
5
-
6
-
7
-
8
-
9
-
10
-
11
-
12
-
13
-
 14
14 -
 15
15 -
 16
16 -
 17
17 -
 18
18 -
 19
19 -
 20
20 -
 21
21 -
 22
22 -
 23
23 -
 24
24 -
 25
25 -
 26
26 -
 27
27 -
 28
28 -
 29
29 -
 30
30 -
 31
31 -
 32
32 -
 33
33 -
 34
34 -
35
-
36
-
37
-
38
-
39
-
40
 |
 |

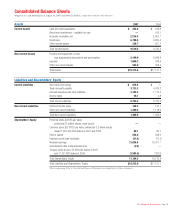
Liquidity and Capital Resources
Cash and cash equivalents were $254.8 million at August 31, 2007, compared to
$919.9 million at August 31, 2006. Short-term investment objectives are to minimize
risk, maintain liquidity and maximize after-tax yields. To attain these objectives,
investment limits are placed on the amount, type and issuer of securities.
Investments are principally in top-tier money market funds and commercial paper.
Net cash provided by operating activities was $2.357 billion in fiscal 2007 and
$2.440 billion in fiscal 2006. The change between periods was primarily caused
by increased net earnings, offset by inventory levels. The lower rate of increase
in accounts receivable, as well as the decrease in accounts payable, reflect the
loss of the UnitedHealth Group’s Ovations unit contract in our pharmacy benefit
management business as of December 31, 2006. Cash provided by operations is
the principal source of funds for expansion, acquisitions, remodeling programs,
dividends to shareholders and stock repurchases. In fiscal 2007, we supplemented
cash provided by operations with short-term borrowings.
Net cash used for investing activities was $2.396 billion versus $1.684 billion last
year. Proceeds from the sale of auction rate securities exceeded purchases of such
securities by $429.1 million in fiscal 2007 compared to $106.0 million in fiscal
2006. Our participation in auction rate securities has included investing in municipal
bonds and student obligations, with purchases of these securities at par. While
the underlying security is issued as a long-term investment, they typically can be
purchased and sold every 7, 28 and 35 days. The trading of auction rate securities
takes place through a descending price auction with the interest rate reset at the
beginning of each holding period. At the end of each holding period the interest is
paid to the investor. At August 31, 2007, there were no holdings of auction rate
securities compared to $415.1 million in fiscal 2006.
Additions to property and equipment were $1.785 billion compared to $1.338 billion
last year. In total there were 563 new or relocated locations (net 478) in fiscal
2007, not including 58 locations acquired from Option Care, Inc. and affiliated
companies. This compared to 570 last year (net 476). New locations are owned
or leased. There were 170 owned locations added during the year and 62 under
construction at August 31, 2007, versus 136 owned locations added and 62 under
construction as of August 31, 2006.
Business acquisitions this year were $1.086 billion versus $485.4 million in fiscal
2006. Acquisitions in fiscal 2007 included the purchase of Option Care, Inc. and
affiliated companies, a specialty pharmacy and home infusion services provider;
Take Care Health Systems, Inc. and LLC, a convenient care clinic operator; selected
assets from Familymeds Group, Inc., a pharmacy chain; the remaining minority
interest in SeniorMed LLC and selected other assets (primarily prescription files).
Business acquisitions in fiscal 2006 included a merger with Delaware-based
Happy Harry’s pharmacy chain and the purchase of Medmark Inc., a specialty
pharmacy; Schraft’s A Specialty Pharmacy; a controlling interest in SeniorMed
LLC, an institutional pharmacy; Home Pharmacy of California, which provides
home infusion services; Canadian Valley Medical Solutions, which provides home
care services; selected assets from the 23-store Medic drugstore chain and
selected other assets (primarily prescription files).
Capital expenditures for fiscal 2008 are expected to be more than $2.0 billion,
excluding business acquisitions. We expect to open 550 new stores in fiscal 2008,
with a net increase of more than 475 stores, and anticipate having a total of
more than 7,000 locations in 2010. We are continuing to relocate stores to more
convenient and profitable freestanding locations. In addition to new stores,
Management’s Discussion and Analysis of Results of Operations
and Financial Condition (continued)
expenditures are planned for distribution centers and technology. A new distribution
center opened in Anderson, South Carolina, in fiscal 2007; another in Windsor,
Connecticut, has an anticipated opening date in fiscal 2009.
Net cash used for financing activities was $626.1 million compared to $413.0 million
last year. During the fiscal year, we purchased $1.064 billion of company shares.
Of this amount, $343.2 million related to the stock repurchase program
announced on July 14, 2004 (“2004 repurchase program”) and finalized in the
first quarter of fiscal 2007. On January 10, 2007, a new stock repurchase program
(“2007 repurchase program”) of up to $1 billion was announced, to be executed
over the next four years. Purchases of company shares relating to the 2007
repurchase program were made in the second, third and fourth quarters in the
amount of $344.9 million. An additional $375.4 million of shares were purchased
to support the needs of the employee stock plans. Comparable amounts in fiscal
2006 were purchases of $289.7 million relating to the 2004 repurchase program
and purchases of $379.1 million to support the needs of the employee stock
plans. We had proceeds related to employee stock plans of $266.1 million in fiscal
2007 versus $319.1 million in fiscal 2006. We do not anticipate executing stock
repurchases under the 2007 repurchase program while having short-term debt
outstanding; however, we will continue to repurchase shares to support the needs
of the employee stock plans.
We had $850.0 million of commercial paper outstanding at a weighted-average
interest rate of 5.36% at August 31, 2007. In connection with our commercial
paper program, we maintain two unsecured backup syndicated lines of credit that
total $1.2 billion. The first $600 million facility expires on August 12, 2008, the
second on August 12, 2012. Our ability to access these facilities is subject to our
compliance with the terms and conditions of the credit facilities, including financial
covenants. The covenants require us to maintain certain financial ratios related to
minimum net worth and priority debt, along with limitations on the sale of assets
and purchases of investments. As of August 31, 2007, we were in compliance with
all such covenants. There were no borrowings against the credit facilities in fiscal
2007. On October 12, 2007, we entered into an additional $100 million unsecured
line of credit facility that expires on December 31, 2007. This line of credit is subject
to similar covenants as the syndicated lines of credit. In connection with the Option
Care, Inc. and affiliated companies acquisition, $118.3 million of convertible debt
was retired prior to August 31, 2007, while $28.5 million remained outstanding as
of that date. On September 6, 2007, the $28.5 million was retired.
Cash dividends paid were $310.2 million for fiscal 2007 versus $262.9 million in
fiscal 2006. A $213.9 million wire transfer made on August 31, 2006, was not
accepted by our disbursement bank until September 1, 2006, resulting in a bank
overdraft at fiscal 2006 year-end and subsequent repayment on September 1, 2006.
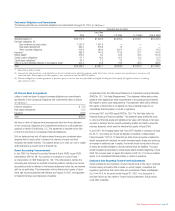
Our credit ratings as of August 31, 2007, were as follows:
Long-Term Commercial
Rating Agency Debt Rating Outlook Paper Rating Outlook
Moody’s Aa3 Negative P-1 Stable
Standard & Poor’s A+ Stable A-1 Stable
In assessing our credit strength, both Moody’s and Standard & Poor’s consider
our business model, capital structure, financial policies and financial statements.
Our credit ratings impact our borrowing costs, access to capital markets and
operating lease costs.
Page 22 2007 Walgreens Annual Report