Walgreens 2008 Annual Report Download - page 22
Download and view the complete annual report
Please find page 22 of the 2008 Walgreens annual report below. You can navigate through the pages in the report by either clicking on the pages listed below, or by using the keyword search tool below to find specific information within the annual report.-
 1
1 -
2
-
3
-
4
-
5
-
6
-
7
-
8
-
9
-
10
-
11
-
 12
12 -
 13
13 -
 14
14 -
 15
15 -
 16
16 -
 17
17 -
 18
18 -
 19
19 -
 20
20 -
 21
21 -
 22
22 -
 23
23 -
 24
24 -
 25
25 -
 26
26 -
 27
27 -
 28
28 -
 29
29 -
 30
30 -
 31
31 -
 32
32 -
33
-
34
-
35
-
36
-
37
-
38
-
39
-
40
 |
 |

with the excess treated as a reduction of inventory costs. We have not made any
material changes to the method of estimating our vendor allowances during the
last three years. Based on current knowledge, we do not believe there is a reasonable
likelihood that there will be a material change in the estimate or assumptions used
to determine vendor allowances.
Liability for closed locations – The liability is based on the present value of future
rent obligations and other related costs (net of estimated sublease rent) to the first
lease option date. We have not made any material changes to the method of
estimating our liability for closed locations during the last three years. Based on
current knowledge, we do not believe there is a reasonable likelihood that there will
be a material change in the estimate or assumptions used to determine the liability.
Liability for insurance claims – The liability for insurance claims is recorded based
on estimates for claims incurred and is not discounted. The provisions are estimated
in part by considering historical claims experience, demographic factors and other
actuarial assumptions. We have not made any material changes to the method of
estimating our liability for insurance claims during the last three years. Based on
current knowledge, we do not believe there is a reasonable likelihood that there will
be a material change in the estimate or assumptions used to determine the liability.
Cost of sales – Drugstore cost of sales is derived based on point-of-sale scanning
information with an estimate for shrinkage and adjusted based on periodic
inventories. Inventories are valued at the lower of cost or market determined by
the last-in, first-out (LIFO) method. We have not made any material changes to the
method of estimating cost of sales during the last three years. Based on current
knowledge, we do not believe there is a reasonable likelihood that there will be a
material change in the estimate or assumptions used to determine cost of sales.
Income taxes – We are subject to routine income tax audits that occur periodically
in the normal course of business. U.S. federal, state and local and foreign tax
authorities raise questions regarding our tax filing positions, including the timing
and amount of deductions and the allocation of income among various tax jurisdic-
tions. In evaluating the tax benefits associated with our various tax filing positions,
we record a tax benefit for uncertain tax positions using the highest cumulative tax
benefit that is more likely than not to be realized. Adjustments are made to our
liability for unrecognized tax benefits in the period in which we determine the issue
is effectively settled with the tax authorities, the statute of limitations expires for
the return containing the tax position or when more information becomes available.
Our liability for unrecognized tax benefits, including accrued penalties and interest,
is included in other long-term liabilities on our consolidated balance sheets and
in income tax expense in our consolidated statements of earnings.
In determining our provision for income taxes, we use an annual effective income tax
rate based on full year income, permanent differences between book and tax income,
and statutory income tax rates. The effective income tax rate also reflects our assess-
ment of the ultimate outcome of tax audits. Discrete events such as audit settlements
or changes in tax laws are recognized in the period in which they occur.
We adopted the provisions of Financial Accounting Standards Board (“FASB”)
Interpretation (“FIN”) No. 48, “Accounting for Uncertainty in Income Taxes –
an Interpretation of FASB Statement No. 109,” effective September 1, 2007. The
adoption of FIN No. 48 resulted in the reclassification of certain tax liabilities
from current to long-term and a decrease in our liability for unrecognized tax
benefits, which was accounted for as an increase to the August 31, 2007,
retained earnings balance. Based on current knowledge, we do not believe there
is a reasonable likelihood that there will be a material change in the estimate
or assumptions used to determine income taxes.
Management’s Discussion and Analysis of Results of Operations
and Financial Condition (continued)
Liquidity and Capital Resources
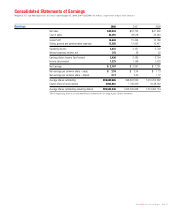
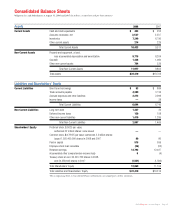
Cash and cash equivalents were $443 million at August 31, 2008, compared to
$255 million at August 31, 2007. Short-term investment objectives are to minimize
risk, maintain liquidity and maximize after-tax yields. To attain these objectives,
investment limits are placed on the amount, type and issuer of securities.
Investments are principally in U.S. Treasury market funds.
Net cash provided by operating activities was $3,039 million in fiscal 2008 and
$2,357 million in fiscal 2007. Higher net earnings and increased cash from payables
and inventories were partially offset by a decrease in cash from accounts receivable.
The decrease in cash from accounts receivable and the increase in cash from trade
accounts payable are primarily attributed to the loss of the UnitedHealth Group’s
Ovations unit contract in our pharmacy benefit management business as of
December 31, 2006. Cash provided by operations is the principal source of funds for
expansion, acquisitions, remodeling programs, dividends to shareholders and stock
repurchases. In fiscal 2008, we supplemented cash provided by operations with
short-term borrowings and long-term debt.
Net cash used for investing activities was $2,818 million versus $2,396 million last
year. We did not engage in auction rate security sales or purchases in the current
year. Proceeds from the sale of auction rate securities exceeded the purchases of
such securities by $429 million a year ago.
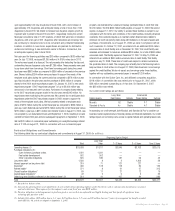
Additions to property and equipment were $2,225 million compared to $1,786 million
last year. During the year, we added a total of 1,031 locations (937 net) compared to
621 last year (536 net). There were 235 owned locations added during the year and
69 under construction at August 31, 2008, versus 170 owned locations added and
62 under construction as of August 31, 2007.
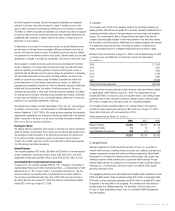
Work- Home Specialty Mail
Drugstores sites Care Pharmacy Service Total
August 31, 2006 5,414 — 38 6 3 5,461
New/Relocated 490 — 11 — — 501
Acquired 59 3 56 2 — 120
Closed/Replaced (81) — (4) — — (85)
August 31, 2007 5,882 3 101 8 3 5,997
New/Relocated 596 4 6 3 (1) 608
Acquired 32 362 27 2 — 423
Closed/Replaced (67) (5) (19) (3) — (94)
August 31, 2008 6,443 364 115 10 2 6,934
Business acquisitions this year were $620 million versus $1,086 million in fiscal
2007. Business acquisitions in 2008 include the purchase of I-trax, Inc. and Whole
Health Management, operators of worksite health centers, including primary and
acute care, wellness, pharmacy and disease management services, and health and
fitness programming; 20 drugstores from Farmacias El Amal; CuraScript Infusion
Pharmacy, Inc., a home infusion services provider; and selected other assets (primarily
prescription files). Acquisitions in fiscal 2007 included the purchase of Option Care,
Inc. and affiliated companies, a specialty pharmacy and home infusion services
provider; Take Care Health Systems, Inc., a convenient care clinic operator; selected
assets from Familymeds Group, Inc., a pharmacy chain; the remaining minority
interest in SeniorMed LLC; and selected other assets (primarily prescription files).
Capital expenditures for fiscal 2009 are expected to be approximately $1.8 billion,
excluding business acquisitions and prescription file purchases. We expect to
Page 20 2008 Walgreens Annual Report