Walgreens 2008 Annual Report Download - page 25
Download and view the complete annual report
Please find page 25 of the 2008 Walgreens annual report below. You can navigate through the pages in the report by either clicking on the pages listed below, or by using the keyword search tool below to find specific information within the annual report.-
 1
1 -
2
-
3
-
4
-
5
-
6
-
7
-
8
-
9
-
10
-
11
-
12
-
13
-
14
-
 15
15 -
 16
16 -
 17
17 -
 18
18 -
 19
19 -
 20
20 -
 21
21 -
 22
22 -
 23
23 -
 24
24 -
 25
25 -
 26
26 -
 27
27 -
 28
28 -
 29
29 -
 30
30 -
 31
31 -
 32
32 -
 33
33 -
 34
34 -
 35
35 -
36
-
37
-
38
-
39
-
40
 |
 |

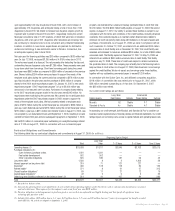
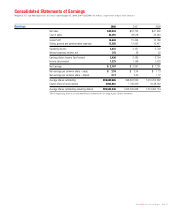
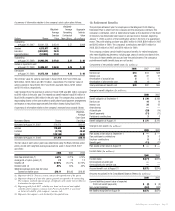
Consolidated Statements of Earnings
Walgreen Co. and Subsidiaries for the years ended August 31, 2008, 2007 and 2006 (In millions, except shares and per share amounts)
2008 Walgreens Annual Report Page 23
Earnings 2008 2007 2006
Net sales $59,034 $53,762 $47,409
Costofsales 42,391 38,518 34,240
Gross Profit 16,643 15,244 13,169
Selling, general and administrative expenses 13,202 12,093 10,467
Operating Income 3,441 3,151 2,702
Interest (expense) income, net (11) 38 52
Earnings Before Income Tax Provision 3,430 3,189 2,754
Income tax provision 1,273 1,148 1,003
Net Earnings $ 2,157 $ 2,041 $ 1,751
Net earnings per common share – basic $ 2.18 $ 2.04 $ 1.73
Net earnings per common share – diluted 2.17 2.03 1.72
Average shares outstanding 990,609,865 998,633,559 1,010,252,562
Dilutive effect of stock options 4,933,681 7,706,509 9,148,162
Average shares outstanding assuming dilution 995,543,546 1,006,340,068 1,019,400,724
The accompanying Notes to Consolidated Financial Statements are integral parts of these statements.