Walgreens 2008 Annual Report Download - page 37
Download and view the complete annual report
Please find page 37 of the 2008 Walgreens annual report below. You can navigate through the pages in the report by either clicking on the pages listed below, or by using the keyword search tool below to find specific information within the annual report.-
 1
1 -
2
-
3
-
4
-
5
-
6
-
7
-
8
-
9
-
10
-
11
-
12
-
13
-
14
-
15
-
16
-
17
-
18
-
19
-
20
-
21
-
22
-
23
-
24
-
25
-
26
-
 27
27 -
 28
28 -
 29
29 -
 30
30 -
 31
31 -
 32
32 -
 33
33 -
 34
34 -
 35
35 -
 36
36 -
 37
37 -
 38
38 -
 39
39 -
 40
40
 |
 |
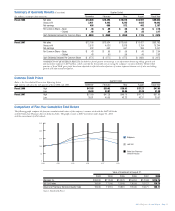
Summary of Quarterly Results (Unaudited) Quarter Ended
(In millions, except per share amounts) November February May August Fiscal Year
Fiscal 2008 Net sales $14,028 $15,394 $15,015 $14,597 $59,034
Gross profit 3,921 4,442 4,245 4,035 16,643
Net earnings 456 686 572 443 2,157
Per Common Share – Basic $ .46 $ .69 $ .58 $ .45 $ 2.18
– Diluted .46 .69 .58 .45 2.17
Cash Dividends Declared Per Common Share $ .0950 $ .0950 $ .0950 $ .1125 $ .3975
Fiscal 2007 Net sales $ 12,708 $ 13,934 $13,699 $13,421 $53,762
Gross profit 3,576 4,036 3,878 3,754 15,244
Net earnings 432 652 561 396 2,041
Per Common Share – Basic $ .43 $ .65 $ .56 $ .40 $ 2.04
– Diluted .43 .65 .56 .40 2.03
Cash Dividends Declared Per Common Share $ .0775 $ .0775 $ .0775 $ .0950 $ .3275
COMMENTS ON QUARTERLY RESULTS: Included in fourth quarter net earnings is an adjustment decreasing selling, general and
administrative expenses by $79 million, which corrected for historically over-accruing the company’s vacation liability. The first three
quarters of fiscal 2008 gross profit have been adjusted to reflect the reclassification of certain expenses between cost of sales and selling,
general and administrative expenses.
Common Stock Prices
Quarter Ended
Below is the Consolidated Transaction Reporting System
high and low sales price for each quarter of fiscal 2008 and 2007. November February May August Fiscal Year
Fiscal 2008 High $47.93 $39.02 $38.93 $37.27 $47.93
Low 36.59 33.01 34.85 31.39 31.39
Fiscal 2007 High $51.60 $47.28 $49.10 $47.72 $51.60
Low 39.91 40.05 43.23 43.31 39.91
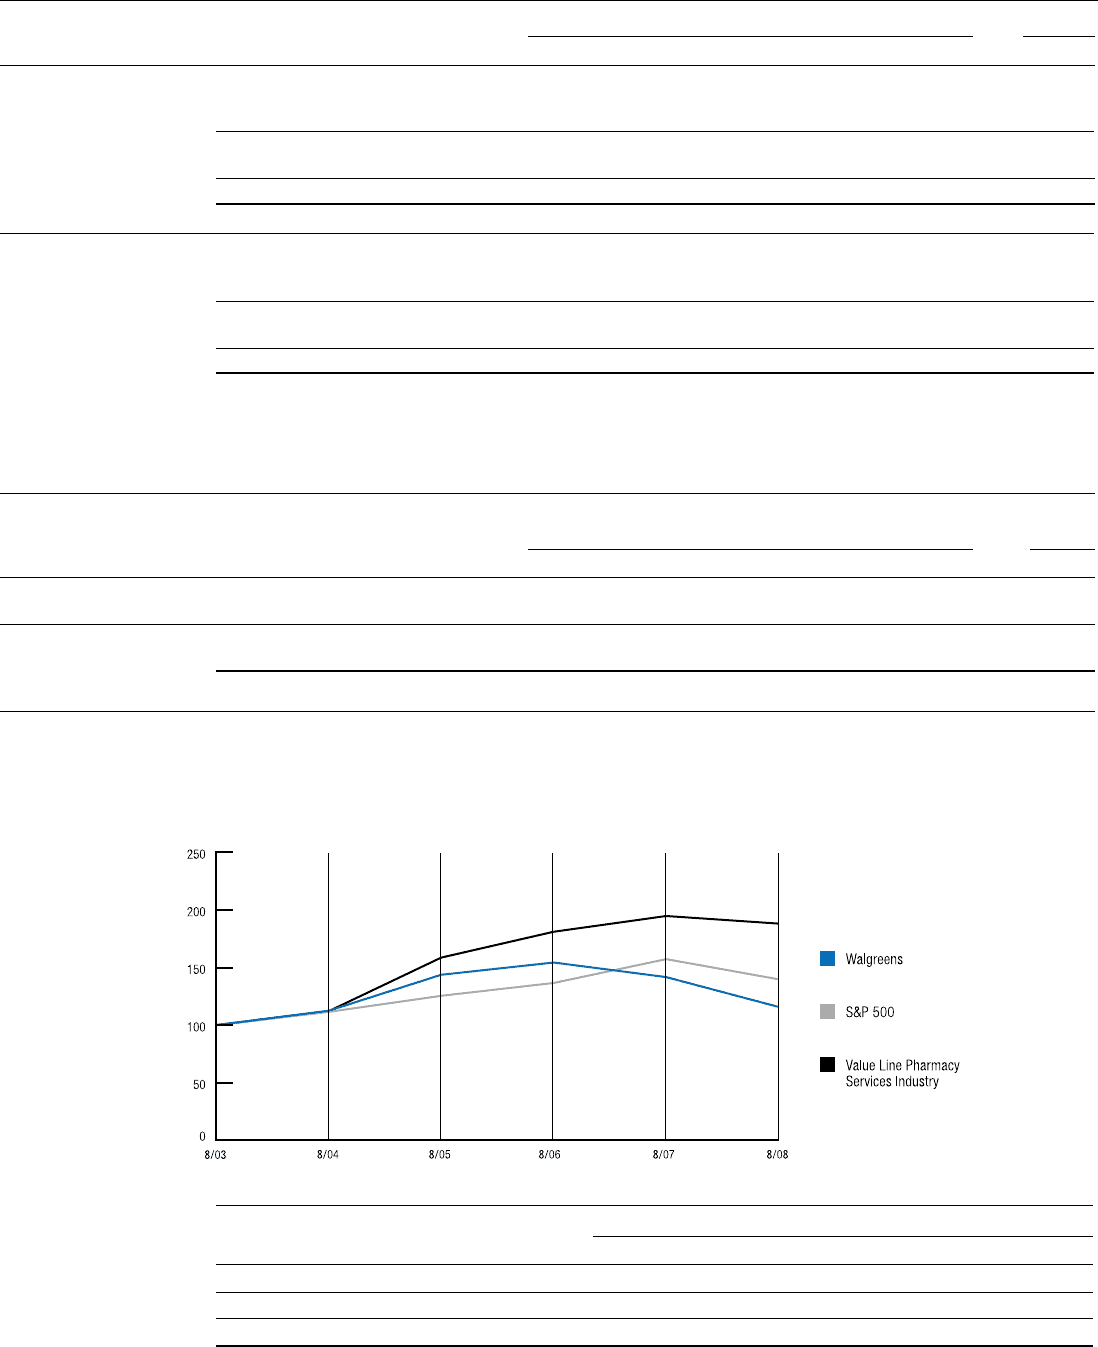
2003 2004 2005 2006 2007 2008
Walgreen Co. $100.00 $112.48 $143.70 $154.34 $141.68 $115.76
S&P 500 Index 100.00 111.46 125.45 136.59 157.27 139.75
Value Line Pharmacy Services Industry Index 100.00 112.10 158.61 181.05 194.71 188.11
Comparison of Five-Year Cumulative Total Return
The following graph compares the five-year cumulative total return of the company’s common stock with the S&P 500 Index
and the Value Line Pharmacy Services Industry Index. The graph assumes a $100 investment made August 31, 2003,
and the reinvestment of all dividends.
2008 Walgreens Annual Report Page 35
Source: Standard &Poor’s
Value of Investment at August 31,