Walgreens 2008 Annual Report Download - page 36
Download and view the complete annual report
Please find page 36 of the 2008 Walgreens annual report below. You can navigate through the pages in the report by either clicking on the pages listed below, or by using the keyword search tool below to find specific information within the annual report.-
 1
1 -
2
-
3
-
4
-
5
-
6
-
7
-
8
-
9
-
10
-
11
-
12
-
13
-
14
-
15
-
16
-
17
-
18
-
19
-
20
-
21
-
22
-
23
-
24
-
25
-
 26
26 -
 27
27 -
 28
28 -
 29
29 -
 30
30 -
 31
31 -
 32
32 -
 33
33 -
 34
34 -
 35
35 -
 36
36 -
 37
37 -
 38
38 -
 39
39 -
 40
40
 |
 |

Page 34 2008 Walgreens Annual Report
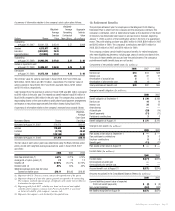
Amounts recognized in accumulated other comprehensive loss (In millions):
2008 2007
Prior service cost (credit) $(57) $ (62)
Net actuarial loss 77 111
Amounts expected to be recognized as components of net periodic costs
for fiscal year 2009 (In millions):
2009
Prior service cost (credit) $(4)
Net actuarial loss 4
The measurement date used to determine postretirement benefits is August 31.
The discount rate assumption used to compute the postretirement benefit obligation
at year-end was 7.30% for 2008 and 6.5% for 2007. The discount rate assumption
used to determine net periodic benefit cost was 6.50%, 6.25%, and 5.50% for fiscal
years ending 2008, 2007, and 2006, respectively.
Future benefit costs were estimated assuming medical costs would increase at a
8.50% annual rate, gradually decreasing to 5.25% over the next six years and
then remaining at a 5.25% annual growth rate thereafter. A one percentage point
change in the assumed medical cost trend rate would have the following effects
(In millions):
1% Increase 1% Decrease
Effect on service and interest cost $ — $ —
Effect on postretirement obligation 14 (14)
Estimated future benefit payments and federal subsidy (In millions):
Estimated Estimated
Future Benefit Federal
Payments Subsidy
2009 $ 9 $ 1
2010 11 1
2011 12 1
2012 14 1
2013 16 2
2014–2018 119 15
The expected contribution to be paid during fiscal year 2009 is $8 million.
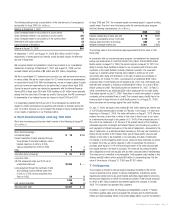
11. Supplementary Financial Information
Non-cash transactions in fiscal 2008 included the identification of $74 million in
accrued liabilities related to the purchase of property and equipment; $24 million of
deferred taxes associated with amortizable intangible assets related to acquisitions;
and $17 million in dividends declared.
Non-cash transactions in fiscal 2007 included the identification of $86 million of
deferred taxes associated with amortizable intangible assets related to acquisitions;
$49 million in postretirement benefit liabilities related to the adoption of SFAS No. 158;
$83 million in accrued liabilities related to the purchase of property and equipment;
$5 million of incurred direct acquisition costs; $4 million related to a leasehold
interest and $16 million in dividends declared.
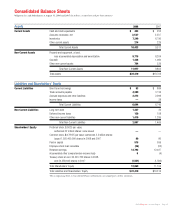
Included in the Consolidated Balance Sheets captions are the following assets
and liabilities (In millions):
2008 2007
Accounts receivable –
Accounts receivable $2,623 $2,306
Allowance for doubtful accounts (96) (69)
$2,527 $2,237
Accrued expenses and other liabilities –
Accrued salaries $ 664 $ 652
Taxes other than income taxes 406 359
Profit sharing 211 185
Insurance 128 144
Other 863 759
$2,272 $2,099
Other non-current liabilities –
Postretirement health care benefits $363 $ 362
Insurance 337 339
Other 710 584
$1,410 $1,285
Notes to Consolidated Financial Statements (continued)