Walgreens 2008 Annual Report Download - page 35
Download and view the complete annual report
Please find page 35 of the 2008 Walgreens annual report below. You can navigate through the pages in the report by either clicking on the pages listed below, or by using the keyword search tool below to find specific information within the annual report.-
 1
1 -
2
-
3
-
4
-
5
-
6
-
7
-
8
-
9
-
10
-
11
-
12
-
13
-
14
-
15
-
16
-
17
-
18
-
19
-
20
-
21
-
22
-
23
-
24
-
 25
25 -
 26
26 -
 27
27 -
 28
28 -
 29
29 -
 30
30 -
 31
31 -
 32
32 -
 33
33 -
 34
34 -
 35
35 -
 36
36 -
 37
37 -
 38
38 -
 39
39 -
 40
40
 |
 |

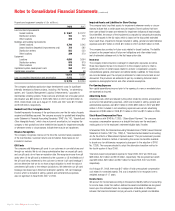
A summary of information relative to the company’s stock option plans follows:
Weighted-
Weighted- Average Aggregate
Average Remaining Intrinsic
Exercise Contractual Value
Options Shares Price Term (Years) (In millions)
Outstanding
at August 31, 2007 35,001,752 $35.04 5.57 $368
Granted 4,313,877 44.32
Exercised (3,590,982) 26.28
Expired/Forfeited (742,084) 37.23
Outstanding
at August 31, 2008 34,982,563 $37.03 5.37 $ 92
Vested or expected to vest
at August 31, 2008 34,806,841 $36.99 5.35 $ 92
Exercisable
at August 31, 2008 24,473,164 $33.07 4.16 $ 92
The intrinsic value for options exercised in fiscal 2008, 2007 and 2006 was
$42 million, $105 million and $173 million, respectively. The total fair value of
options vested in fiscal 2008, 2007 and 2006 was $46 million, $102 million
and $116 million, respectively.
Cash received from the exercise of options in fiscal 2008 was $94 million compared
to $142 million in the prior year. The related tax benefit realized was $16 million in
fiscal 2008 compared to $40 million in the prior year. The company has a practice of
repurchasing shares on the open market to satisfy share-based payment arrangements
and expects to repurchase approximately five million shares during fiscal 2009.
A summary of information relative to the company’s restricted stock awards follows:
Weighted-
Average
Grant-Date
Nonvested Shares Shares Fair Value
Nonvested at August 31, 2007 279,674 $45.63
Granted 178,623 36.36
Forfeited (2,719) 45.60
Vested (138,168) 44.93
Nonvested at August 31, 2008 317,410 $40.72
The fair value of each option grant was determined using the Black-Scholes option
pricing model with weighted-average assumptions used in fiscal 2008, 2007
and 2006:
2008 2007 2006
Risk-free interest rate (1) 4.41% 4.71% 4.10%
Average life of option (years) (2) 7.2 7.2 7.2
Volatility (3) 27.61% 25.77% 32.12%
Dividend yield (4) .81% .50% .45%
Weighted-average grant-date fair value
Granted at market price $16.11 $18.05 $18.82
(1) Represents the U.S. Treasury security rates for the expected term of the option.
(2) Represents the period of time that options granted are expected to be outstanding.
The company analyzed separate groups of employees with similar exercise behavior
to determine the expected term.
(3) Beginning with fiscal 2007, volatility was based on historical and implied
volatility of the company’s common stock. Prior to fiscal 2007, it was based
on historical volatility of the company’s common stock.
(4) Represents the company’s cash dividend for the expected term.
10. Retirement Benefits
The principal retirement plan for employees is the Walgreen Profit-Sharing
Retirement Plan to which both the company and the employees contribute. The
company’s contribution, which is determined annually at the discretion of the Board
of Directors, has historically been based on pre-tax income; however, beginning
January 1, 2008, a portion of that contribution will be in the form of a guaranteed
match. The profit-sharing provision was $305 million in 2008, $284 million in 2007
and $245 million in 2006. The company’s contributions were $261 million for
2008, $253 million for 2007 and $216 million for 2006.
The company provides certain health insurance benefits for retired employees
who meet eligibility requirements, including age, years of service and date of hire.
The costs of these benefits are accrued over the period earned. The company’s
postretirement health benefit plans are not funded.
Components of net periodic benefit costs (In millions):
2008 2007 2006
Service cost $14 $14 $18
Interest cost 24 22 21
Amortization of actuarial loss 559
Amortization of prior service cost (4) (4) (4)
Total postretirement benefit cost $39 $37 $44
Change in benefit obligation (In millions):
2008 2007
Benefit obligation at September 1 $ 370 $ 356
Service cost 14 14
Interest cost 24 22
Amendments ——
Actuarial gain (29) (14)
Benefit payments (11) (11)
Participants contributions 33
Benefit obligation at August 31 $ 371 $ 370
Change in plan assets (In millions):
2008 2007
Plan assets at fair value at September 1 $— $—
Plan participants contributions 33
Employer contributions 88
Benefits paid (11) (11)
Plan assets at fair value at August 31 $— $—
Funded status (In millions):
2008 2007
Funded status $(371) $(370)
Unrecognized actuarial gain ——
Unrecognized prior service cost ——
Accrued benefit cost at August 31 $(371) $(370)
Amounts recognized in the Consolidated Balance Sheets (In millions):
2008 2007
Current liabilities (present value of expected
2009 net benefit payments) $ (8) $ (8)
Non-current liabilities (363) (362)
Net liability recognized at August 31 $(371) $(370)
2008 Walgreens Annual Report Page 33