Walmart 2005 Annual Report Download - page 30
Download and view the complete annual report
Please find page 30 of the 2005 Walmart annual report below. You can navigate through the pages in the report by either clicking on the pages listed below, or by using the keyword search tool below to find specific information within the annual report.-
 1
1 -
2
-
3
-
4
-
5
-
6
-
7
-
8
-
9
-
10
-
11
-
12
-
13
-
14
-
15
-
16
-
17
-
18
-
19
-
 20
20 -
 21
21 -
 22
22 -
 23
23 -
 24
24 -
 25
25 -
 26
26 -
 27
27 -
 28
28 -
 29
29 -
 30
30 -
 31
31 -
 32
32 -
 33
33 -
 34
34 -
 35
35 -
 36
36 -
 37
37 -
 38
38 -
 39
39 -
 40
40 -
41
-
42
-
43
-
44
-
45
-
46
-
47
-
48
-
49
-
50
-
51
-
52
-
53
-
54
-
55
-
56
-
57
-
58
-
59
-
60
 |
 |
Management’s Discussion and Analysis of
Results of Operations and Financial Condition
W A L -M A R T
28 WAL-MART 2005 ANNUAL REPORT
Fiscal 2005 sales at our United Kingdom subsidiary, ASDA, were
46.2% of the International segment net sales. Sales for ASDA
included in our consolidated income statement during fiscal 2005,
2004, and 2003 were $26.0 billion, $21.7 billion, and $18.1 bil-
lion, respectively.
The fiscal 2005 increase in segment operating income as a percent-
age of segment sales compared with fiscal 2004 resulted primar-
ily from a 0.3% improvement in gross margin. The improvement
in gross margin was due to a favorable shift in the mix of products
sold toward general merchandise categories which carry a higher
margin. Fiscal 2005 operating income includes a favorable impact
of $150 million from changes in foreign currency exchange rates.
The fiscal 2004 increase in segment operating income as a per-
centage of segment net sales compared with fiscal 2003 resulted
from a 0.4% improvement in gross margin offset by increases in
operating expenses primarily due to the adoption of EITF 02-16.
The improvement in gross margin was due to an overall increase
as a percentage of the segment’s net sales in general merchandise
sales which carry a higher margin. The International segment’s
operating income in fiscal 2004 included a favorable impact of
$81 million from changes in foreign currency exchange rates.
Our financial results from our foreign operations could be affected
by factors such as changes in foreign currency exchange rates,
weak economic conditions, changes in tax law and government
regulations in the foreign markets in which we operate. We mini-
mize exposure to the risk of devaluation of foreign currencies by
operating in local currencies.
Liquidity and Capital Resources
Overview
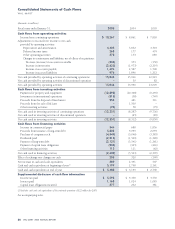
Cash flows provided by operating activities of continuing opera-
tions provide us with a significant source of liquidity. Our cash
flows from operating activities of continuing operations were
$15.0 billion in fiscal 2005, compared with $15.9 billion in fiscal
2004. The decrease in cash flows provided by operating activities
of continuing operations is primarily attributable to differences in
the timing of payroll, income and other taxes, supplier payments
and the timing of the collection of receivables in fiscal 2005 com-
pared with fiscal 2004.
Operating cash flows provided by continuing operations increased
during fiscal 2004 compared with fiscal 2003 primarily due to
improved operations and inventory management, accounts pay-
able growing at a faster rate than inventories and the timing of
payroll and the collection of receivables.
In fiscal 2005, we paid dividends of $2.2 billion, made $12.9 bil-
lion in capital expenditures, paid $4.5 billion to repurchase shares
of our common stock, received $5.8 billion from the issuance of
long-term debt and repaid $2.1 billion of long-term debt.
Working Capital
Current liabilities exceeded current assets at January 31, 2005, by
$4.4 billion, an increase of $978 million from January 31, 2004.
Our ratio of current assets to current liabilities was 0.9 to 1 at
January 31, 2005 and 2004. At January 31, 2005, we had total
assets of $120.2 billion compared with total assets of $105.4 bil-
lion at January 31, 2004.
Company Share Repurchase Program
In September 2004, our Board of Directors approved a new
$10.0 billion share repurchase program, separate from and replac-
ing the previous $7.0 billion program authorized in January 2004.
Through January 31, 2005, we have repurchased $337 million
of shares under the $10.0 billion share repurchase program. At
January 31, 2005, approximately $9.7 billion of additional shares
may be repurchased under the current authorization. There is no
expiration date governing the period over which we can make our
share repurchases. Under our share repurchase programs, repurchased
shares are constructively retired and returned to unissued status.
Total fiscal 2005 share repurchases under our share repurchase
programs were $4.5 billion. During fiscal 2004, we repurchased
$5.0 billion of shares.
We consider several factors in determining when to make share
repurchases, including among other things, our current cash
needs, our cost of borrowing, and the market price of the stock.
The increased authorization approved in September 2004, in part,
contemplates possible repurchases of our shares that may become
available for purchase as a result of the Standard & Poor’s (“S&P”)
Index float adjustment implemented in March and September of
2005. Under the float adjustment, share counts used to determine
the S&P indices will reflect only those shares that are available to
investors, not all outstanding shares. The float adjustment will
exclude shares closely held by control groups. As a result our
relative weight in the S&P indices will decline as the S&P indices
are adjusted in March and September of 2005. We expect that
such adjustments in the S&P indices will cause investment funds
that base their portfolio allocations on S&P indices to sell a portion
of the shares of the company they hold in order to rebalance their
funds based on the new S&P index weightings.
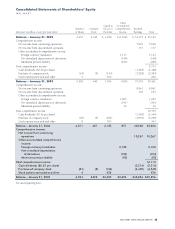
Common Stock Dividends
We paid dividends totaling approximately $1.6 billion or $0.36 per
share in fiscal 2004. In March 2004, our Board of Directors autho-
rized a 44% increase in our annual dividend to $0.52 per share.
As a result, we paid $2.2 billion in dividends in fiscal 2005. We
have increased our dividend every year since the first dividend
was declared in March 1974.
On March 3, 2005, the company’s Board of Directors approved an
increase in annual dividends to $0.60 per share. The annual dividend
will be paid in four quarterly installments on April 4, 2005, June 6,
2005, September 6, 2005, and January 3, 2006 to holders of record
on March 18, May 20, August 19 and December 16, 2005, respectively.