Walmart 2005 Annual Report Download - page 46
Download and view the complete annual report
Please find page 46 of the 2005 Walmart annual report below. You can navigate through the pages in the report by either clicking on the pages listed below, or by using the keyword search tool below to find specific information within the annual report.-
 1
1 -
2
-
3
-
4
-
5
-
6
-
7
-
8
-
9
-
10
-
11
-
12
-
13
-
14
-
15
-
16
-
17
-
18
-
19
-
20
-
21
-
22
-
23
-
24
-
25
-
26
-
27
-
28
-
29
-
30
-
31
-
32
-
33
-
34
-
35
-
 36
36 -
 37
37 -
 38
38 -
 39
39 -
 40
40 -
 41
41 -
 42
42 -
 43
43 -
 44
44 -
 45
45 -
 46
46 -
 47
47 -
 48
48 -
 49
49 -
 50
50 -
 51
51 -
 52
52 -
 53
53 -
 54
54 -
 55
55 -
 56
56 -
57
-
58
-
59
-
60
 |
 |

Notes to Consolidated Financial Statements
W A L -M A R T
44 WAL-MART 2005 ANNUAL REPORT
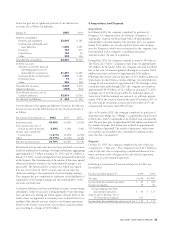
The effective tax rate on the gain from the sale of McLane was
49% as a result of the non-deductibility of $99 million of goodwill
recorded in the original McLane acquisition.
7 Stock-Based Compensation Plans
On February 1, 2003, the company adopted the expense recogni-
tion provisions of SFAS 123. Under SFAS 123, compensation expense
is recognized based on the fair value of stock options granted. As a
result, all prior periods presented have been restated to reflect the
compensation cost that would have been recognized had the recog-
nition provisions of SFAS 123 been applied to all awards granted
to employees since February 1, 1995. Following the provisions of
SFAS 123, fiscal 2005, 2004 and 2003 include $122 million,
$102 million and $84 million, respectively, of after-tax stock
option expense, which is approximately $0.03 per share in fiscal
year 2005 and $0.02 per share for fiscal years 2004 and 2003.
In the United States and certain other countries, options granted
under the stock option plans generally expire 10 years from the date
of grant. Options granted prior to November 17, 1995, vest over
nine years. Generally, options granted on or after November 17,
1995 and before fiscal 2001 vest over seven years. Options granted
after fiscal 2001 vest over five years. Shares issued upon the exer-
cise of options are newly issued.
The company’s United Kingdom subsidiary, ASDA, offers two
different stock option plans to associates. The first plan, The ASDA
Colleague Share Ownership Plan 1999 (“CSOP”) grants options to
certain associates. Options granted under the CSOP Plan generally
expire six years from the date of grant, with half vesting on the third
anniversary of the date of grant and the other half on the sixth anni-
versary of the date of grant. The second plan, The ASDA Sharesave
Plan 2000 (“Sharesave”), grants options to certain associates at 80%
of market value on date of grant. Sharesave options become exercis-
able after either a three-year or five-year period and generally lapse
six months after becoming exercisable.
At January 31, 2005, total unrecognized compensation cost for
unvested stock option awards was $478 million, with a weighted-
average remaining vesting period of 3.6 years.
At January 31, 2005, the aggregate intrinsic value of stock
options outstanding and exercisable was $490 million and
$361 million, respectively.
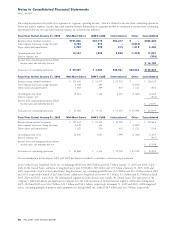
The following table summarizes additional information about stock options outstanding as of January 31, 2005:
Number of Weighted-Average Weighted-Average Weighted-Average Weighted-Average
Range of Outstanding Remaining Life Exercise Price of Number of Remaining Life Exercise Price of
Exercise Prices Options in Years Outstanding Options Options Exercisable in Years Exercisable Options
$ 4.24 to 11.19 700,000 1.1 $11.12 689,000 1.1 $11.12
11.75 to 13.63 3,085,000 1.5 11.84 3,067,000 1.5 11.84
17.53 to 23.33 3,819,000 3.0 19.35 3,764,000 3.0 19.35
25.00 to 38.72 2,233,000 5.6 35.23 462,000 5.3 26.86
39.86 to 45.69 5,624,000 5.6 40.34 2,648,000 4.0 40.15
46.00 to 54.98 54,889,000 8.3 50.76 12,770,000 6.7 49.57
55.25 to 60.90 10,041,000 7.2 56.51 4,303,000 7.0 56.43
$ 4.24 to 60.90 80,391,000 7.3 $47.03 27,703,000 5.2 $40.12
Further information concerning the options is as follows:
Option Price Weighted-Average
Shares Per Share Per Share Total
January 31, 2002 53,470,000 $ 4.24 – 63.44 $ 32.25 $ 1,724,537,000
(16,823,000 shares exercisable)
Options granted 15,267,000 48.41 – 57.80 54.32 829,244,000
Options canceled (3,037,000) 4.24 – 63.44 42.07 (127,752,000)
Options exercised (6,595,000) 4.24 – 55.94 23.90 (157,588,000)
January 31, 2003 59,105,000 $ 4.24 – 60.90 $ 38.38 $ 2,268,441,000
(20,053,000 shares exercisable)
Options granted 26,136,000 47.02 – 59.92 49.65 1,297,604,000
Options canceled (4,006,000) 4.24 – 60.90 45.09 (180,666,000)
Options exercised (7,488,000) 4.24 – 56.80 22.89 (171,389,000)
January 31, 2004 73,747,000 $ 4.24 – 60.90 $ 43.58 $ 3,213,990,000
(23,763,000 shares exercisable)
Options granted 18,575,000 44.60 – 60.46 52.37 972,825,000
Options canceled (3,563,000) 4.24 – 58.10 48.01 (171,026,000)
Options exercised (8,368,000) 4.24 – 56.80 28.08 (234,986,000)
January 31, 2005 80,391,000 $ 4.24 – 60.90 $47.03 $3,780,803,000
(27,703,000 shares exercisable)
At January 31, 2005 and 2004, there were 87.5 million and 102.5 million shares, respectively, available for grant under the company’s
stock option plans.