Walmart 2005 Annual Report Download - page 42
Download and view the complete annual report
Please find page 42 of the 2005 Walmart annual report below. You can navigate through the pages in the report by either clicking on the pages listed below, or by using the keyword search tool below to find specific information within the annual report.-
 1
1 -
2
-
3
-
4
-
5
-
6
-
7
-
8
-
9
-
10
-
11
-
12
-
13
-
14
-
15
-
16
-
17
-
18
-
19
-
20
-
21
-
22
-
23
-
24
-
25
-
26
-
27
-
28
-
29
-
30
-
31
-
 32
32 -
 33
33 -
 34
34 -
 35
35 -
 36
36 -
 37
37 -
 38
38 -
 39
39 -
 40
40 -
 41
41 -
 42
42 -
 43
43 -
 44
44 -
 45
45 -
 46
46 -
 47
47 -
 48
48 -
 49
49 -
 50
50 -
 51
51 -
 52
52 -
53
-
54
-
55
-
56
-
57
-
58
-
59
-
60
 |
 |

Notes to Consolidated Financial Statements
W A L -M A R T
40 WAL-MART 2005 ANNUAL REPORT
the provisions of SFAS 123(R) upon its release. Prior to the adop-
tion of SFAS 123(R), we used the Black-Scholes-Merton formula to
estimate the value of stock options granted to associates. We con-
tinue to use this acceptable option valuation model following our
adoption of SFAS 123(R). SFAS 123(R) requires that the benefits
of tax deductions in excess of recognized compensation cost be
reported as a financing cash flow, rather than as an operating cash
flow as required under previously effective accounting principles
generally accepted in the United States. The adoption of SFAS
123(R) did not have a material impact on our results of operations,
financial position or cash flows.
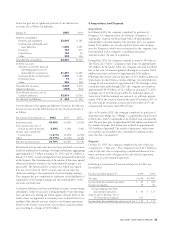
2 Commercial Paper and Long-term Debt
Information on short-term borrowings and interest rates is as fol-
lows (dollars in millions):
Fiscal year 2005 2004 2003
Maximum amount outstanding
at any month-end $7,782 $4,957 $4,226
Average daily short-term
borrowings $4,823 $1,498 $1,549
Weighted-average interest rate 1.6% 1.1% 1.7%
At January 31, 2005 and 2004, short-term borrowings consisted
of $3.8 billion and $3.3 billion, respectively, of commercial paper.
At January 31, 2005, the company had committed lines of $4.5 bil-
lion with 53 firms and banks, which were used to support commer-
cial paper, and committed and informal lines of credit with various
banks totaling an additional $159 million.
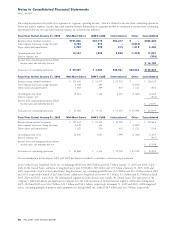
Long-term debt at January 31, consists of (in millions):
Interest Rate Due by Fiscal Year 2005 2004
4.000 – 6.875% Notes due 2010 $ 4,500 $ 3,500
2.792 – 8.000%, Notes due 2007 3,164 2,130
LIBOR less 0.140%
4.550% – 7.250% Notes due 2014 2,883 2,854
4.150 – 5.875% Notes due 2006 2,597 2,597
LIBOR less 0.0425%
4.125% Notes due 2012 2,000 –
5.750% – 7.550% Notes due 2031 1,941 1,912
5.250% Notes due 2036 1,883 –
4.375% Notes due 2008 1,500 1,500
3.375% Notes due 2009 1,000 1,000
5.006% Notes due 2019(1) 500 500
6.200% Notes due 2011(1) 500 500
6.750% Notes due 2024 250 250
6.550% – 7.500% Notes due 2005 – 1,750
8.500% Notes due 2025 – 250
Other (2) 1,128 1,263
$23,846 $20,006
(1) Includes put option.
(2) Includes adjustments to debt hedged by derivatives.
The company has two separate issuances of $500 million debt
with embedded put options. For the first issuance, beginning June
2001, and each year thereafter, the holders of $500 million of the
debt may require the company to repurchase the debt at face
value, in addition to accrued and unpaid interest. The holders of
the other $500 million issuance may put the debt back to the
company at par plus accrued interest at any time. Both of these
issuances have been classified as a current liability in the
Consolidated Balance Sheets.
Under the company’s most significant borrowing arrangements,
the company is not required to observe financial covenants.
However, under certain lines of credit totaling $4.5 billion which
were undrawn as of January 31, 2005, the company has agreed to
observe certain covenants, the most restrictive of which relates to
minimum net worth levels and amounts of additional secured debt
and long-term leases. The company was not in violation of these
covenants at January 31, 2005.
Long-term debt is unsecured except for $68 million, which is col-
lateralized by property with an aggregate carrying value of approxi-
mately $171 million. Annual maturities of long-term debt during
the next five years and thereafter are (in millions):
Fiscal Year Ended January 31, Annual Maturity
2006 $ 3,759
2007 3,400
2008 1,572
2009 1,037
2010 4,774
Thereafter 9,304
Total $ 23,846
The company has entered into sale/leaseback transactions involv-
ing buildings while retaining title to the underlying land. These
transactions were accounted for as financings and are included in
long-term debt and the annual maturities schedule above. The
resulting obligations are amortized over the lease terms. Future
minimum lease payments during the next five years and thereafter
are (in millions):
Fiscal Year Ended January 31, Minimum Payments
2006 $ 20
2007 18
2008 17
2009 11
2010 11
Thereafter 43
Total $ 120
At January 31, 2005 and 2004, the company had trade letters of
credit outstanding totaling $2.6 billion and $2.0 billion, respectively.
These letters of credit were issued primarily for the purchase of inven-
tory. At January 31, 2005 and 2004, the company had standby letters
of credit outstanding totaling $2.0 billion and $1.4 billion, respectively.