Walmart 2006 Annual Report Download - page 24
Download and view the complete annual report
Please find page 24 of the 2006 Walmart annual report below. You can navigate through the pages in the report by either clicking on the pages listed below, or by using the keyword search tool below to find specific information within the annual report.-
 1
1 -
2
-
3
-
4
-
5
-
6
-
7
-
8
-
9
-
10
-
11
-
12
-
13
-
 14
14 -
 15
15 -
 16
16 -
 17
17 -
 18
18 -
 19
19 -
 20
20 -
 21
21 -
 22
22 -
 23
23 -
 24
24 -
 25
25 -
 26
26 -
 27
27 -
 28
28 -
 29
29 -
 30
30 -
 31
31 -
 32
32 -
 33
33 -
 34
34 -
35
-
36
-
37
-
38
-
39
-
40
-
41
-
42
-
43
-
44
-
45
-
46
-
47
-
48
-
49
-
50
-
51
-
52
-
53
-
54
-
55
-
56
 |
 |

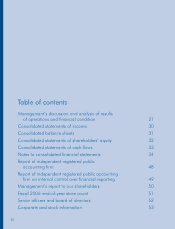
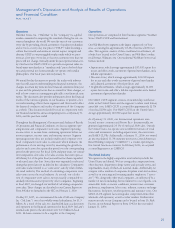
Management’s Discussion and Analysis of Results of Operations
and Financial Condition
WAL-MART
22
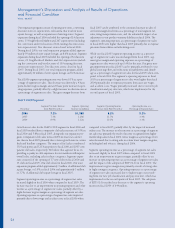
Key Items in Fiscal 2006
Signifi cant fi nancial items during fi scal 2006 include:
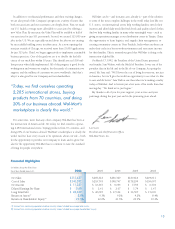
• Net sales increased 9.5% from fi scal 2005 to $312.4 billion in
fi scal 2006, and net income increased 9.4% to $11.2 billion.
Foreign currency exchange rates favorably impacted sales and
operating income by $1.5 billion and $64 million, respectively,
in fi scal 2006.
• Net cash provided by operating activities was $17.6 billion for
fi scal 2006. During fi scal 2006, we repurchased $3.6 billion of
our common stock under our share repurchase program and
paid dividends of $2.5 billion. Additionally during fi scal 2006,
we issued $7.7 billion in long-term debt, repaid $2.7 billion of
long-term debt and funded a net decrease in commercial paper
of $704 million.
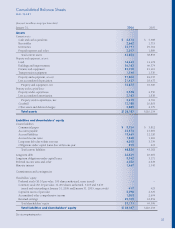
• Total assets increased 15.0%, to $138.2 billion at January 31,
2006, when compared to January 31, 2005. During fi scal 2006,
we made $14.6 billion of capital expenditures which was an
increase of 13.0% over capital expenditures of $12.9 billion in
fi scal 2005.
• When compared to fi scal 2005, our Wal-Mart Stores segment
experienced an 8.2% increase in operating income and a 9.4%
increase in net sales in fi scal 2006.
• SAM’S CLUB’s continued focus on our business members helped
drive an 8.2% increase in operating income on a 7.2% increase in
net sales when comparing fi scal 2006 with fi scal 2005.
• Our International segment generated a net sales and operating
income increase of 11.4% compared to fi scal 2005.
Company Performance Measures
Management uses a number of metrics to assess the Company’s per-
formance. The following are the more frequently used metrics:
• Comparative store sales is a measure which indicates the perfor-
mance of our existing stores by measuring the growth in sales for
such stores for a particular period over the corresponding period
in the prior year. Our Wal-Mart Stores segment’s comparative
store sales were 3.0% for fi scal 2006 versus 2.9% for fi scal 2005.
Our SAM’S CLUB segment’s comparative club sales were 5.0%
in fi scal 2006 versus 5.8% in fi scal 2005.
• Operating income growth greater than net sales growth has long
been a measure of success for us. For fi scal 2006, our operating
income increased by 8.4% when compared to fi scal 2005, while
net sales increased by 9.5% over the same period. Our SAM’S
CLUB segment met this target; however, the Wal-Mart Stores
segment fell short of the target, while the International segment
grew operating income at the same rate as net sales.
• Inventory growth at a rate less than that of net sales is a key
measure of our effi ciency. However, our increased purchases of
imported merchandise and recent acquisition activity impact this
measure. Total inventories at January 31, 2006, were up 8.2%
over levels at January 31, 2005, and net sales were up 9.5% when
comparing fi scal 2006 with fi scal 2005. Approximately 150 basis
points of the fi scal 2006 increase in inventory was from increased
levels of imported merchandise, which carries a longer lead time,
and an additional 170 basis points was from the consolidation of
The Seiyu, Ltd. and the purchase of Sonae Distribuição Brasil S.A.
• With an asset base as large as ours, we are focused on continuing
to make certain our assets are productive. It is important for us to
sustain our return on assets. Return on assets is defi ned as income
from continuing operations before minority interest divided by aver-
age total assets. Return on assets for fi scal 2006, 2005 and 2004
was 8.9%, 9.3% and 9.2%, respectively. Return on assets in fi scal
2006 was impacted by acquisition activity in the fourth quarter.
Results of Operations
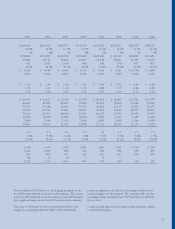
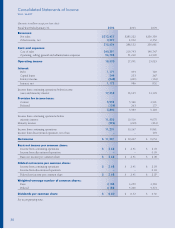
The Company and each of its operating segments had net sales (in millions), as follows:
Fiscal Year Ended January 31, 2006 2005 2004
Percent Percent Percent Percent Percent
Net sales of total increase Net sales of total increase Net sales of total
Wal-Mart Stores $209,910 67.2% 9.4% $191,826 67.3% 10.1% $174,220 68.0%
SAM’S CLUB 39,798 12.7% 7.2% 37,119 13.0% 7.5% 34,537 13.5%
International 62,719 20.1% 11.4% 56,277 19.7% 18.3% 47,572 18.5%
Total net sales $312,427 100.0% 9.5% $285,222 100.0% 11.3% $256,329 100.0%
Our total net sales increased by 9.5% and 11.3% in fi scal 2006
and 2005 when compared to the previous fi scal year. Those
increases resulted from our expansion programs and comparative
store sales increases in the United States. Comparative store sales
increased 3.4% in fi scal 2006 and 3.3% in fi scal 2005. As we con-
tinue to add new stores in the United States, we do so with
an understanding that additional stores may take sales away from
existing units. We estimate that comparative store sales in fi scal
2006, 2005 and 2004 were negatively impacted by the opening
of new stores by approximately 1% per year. We expect that this
effect of opening new stores on comparable store sales will con-
tinue during fi scal 2007 at a similar rate.