Walmart 2006 Annual Report Download - page 26
Download and view the complete annual report
Please find page 26 of the 2006 Walmart annual report below. You can navigate through the pages in the report by either clicking on the pages listed below, or by using the keyword search tool below to find specific information within the annual report.-
 1
1 -
2
-
3
-
4
-
5
-
6
-
7
-
8
-
9
-
10
-
11
-
12
-
13
-
14
-
15
-
 16
16 -
 17
17 -
 18
18 -
 19
19 -
 20
20 -
 21
21 -
 22
22 -
 23
23 -
 24
24 -
 25
25 -
 26
26 -
 27
27 -
 28
28 -
 29
29 -
 30
30 -
 31
31 -
 32
32 -
 33
33 -
 34
34 -
 35
35 -
 36
36 -
37
-
38
-
39
-
40
-
41
-
42
-
43
-
44
-
45
-
46
-
47
-
48
-
49
-
50
-
51
-
52
-
53
-
54
-
55
-
56
 |
 |

Management’s Discussion and Analysis of Results of Operations
and Financial Condition
WAL-MART
24
Our expansion programs consist of opening new units, converting
discount stores to supercenters, relocations that result in more
square footage, as well as expansions of existing stores. Segment
expansion during fi scal 2006 included the opening of 24 discount
stores, 15 Neighborhood Markets and 267 supercenters (including
the conversion and/or relocation of 166 existing discount stores
into supercenters). Two discount stores closed in fi scal 2006.
During fi scal 2006, our total expansion program added approxi-
mately 39 million of store square footage, an 8.6% increase. Segment
expansion during fi scal 2005 included the opening of 36 discount
stores, 21 Neighborhood Markets and 242 supercenters (includ-
ing the conversion and/or relocation of 159 existing discount
stores into supercenters). Two discount stores closed in fi scal
2005. During fi scal 2005, our total expansion program added
approximately 36 million of store square footage, an 8.6% increase.
Fiscal 2006 segment operating income was down 0.1% as a per-
centage of segment net sales. This decrease was driven by a 4 basis
point decline in gross margin and an 8 basis point increase in oper-
ating expenses, partially offset by a slight increase in other income as
a percentage of segment net sales. This gross margin decrease from
fi scal 2005 can be attributed to the continued increase in sales of
our lower-margin food items as a percentage of total segment net
sales, rising transportation costs, and the unfavorable impact of an
adjustment to our product warranty liabilities in fi scal 2006. The
segment’s operating expenses as a percentage of segment net sales
in fi scal 2006 were higher than fi scal 2005 primarily due to expense
pressures from utilities and advertising costs.
While our fi scal 2005 segment operating income as a percent-
age of segment net sales was unchanged from fi scal 2004, seg-
ment gross margin and operating expenses as a percentage of
segment net sales were each up 0.4% for the year. Our gross mar-
gin improvement in fi scal 2005 can be primarily attributed to our
global sourcing effort and reductions in markdowns and shrink-
age as a percentage of segment net sales for fi scal 2005 when com-
pared to fi scal 2004. The segment’s operating expenses in fi scal
2005 as a percentage of segment net sales were higher than fi scal
2004 primarily due to expense pressures from associate wages
and accident costs. Wages primarily increased due to our new job
classifi cation and pay structure, which was implemented in the
second quarter of fi scal 2005.
Growth in net sales for the SAM’S CLUB segment in fi scal 2006 and
fi scal 2005 resulted from comparative club sales increases of 5.0% in
fi scal 2006 and 5.8% in fi scal 2005, along with our expansion pro-
gram. Comparative club sales in fi scal 2006 increased at a slower
rate than in fi scal 2005 primarily due to lower growth rates in certain
fresh and hardline categories. The impact of fuel sales contributed
130 basis points and 121 basis points to fi scal 2006 and 2005 com-
parative club sales, respectively. We believe that a greater focus on
providing a quality in-club experience for our members will improve
overall sales, including sales in these categories. Segment expan-
sion consisted of the opening of 17 new clubs in fi scal 2006 and
13 clubs in fi scal 2005. One club closed in fi scal 2006. Our total
expansion program added approximately 3 million of additional club
square footage, or 3.8%, in fi scal 2006 and approximately 3 million,
or 3.7%, of additional club square footage in fi scal 2005.
Segment operating income as a percentage of segment net sales
increased slightly in fi scal 2006 when compared to fi scal 2005. The
increase was due to an improvement in operating expenses and other
income as a percentage of segment net sales, partially offset by a
slight decrease in gross margin as a percentage of segment net sales.
Operating expenses as a percentage of segment net sales improved
primarily due to lower wage and accident costs in fi scal 2006 when
compared to fi scal 2005, partially offset by the impact of increased
utility costs. The increase in other income as a percentage of segment
net sales was primarily the result of income recognized from higher
membership sales in fi scal 2006. Gross margin as a percentage of net
sales decreased due to strong sales in certain lower margin categories,
including fuel and tobacco, during fi scal 2006.
Segment operating income as a percentage of segment net sales
increased slightly in fi scal 2005 when compared to fi scal 2004
due to an improvement in gross margin, partially offset by an
increase in operating expenses as a percentage of segment net sales
and the impact of the adoption of EITF 02-16 in fi scal 2004. The
improvement in gross margin was primarily a result of strong sales
in higher margin categories. Operating expenses as a percentage
of segment net sales increased due to higher wage costs result-
ing from our new job classifi cation and pay structure, which was
implemented in the second quarter of fi scal 2005. The adoption
of EITF 02-16 resulted in a decrease to the segment’s operating
income in fi scal 2004 of $44 million.
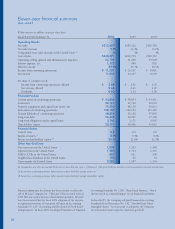
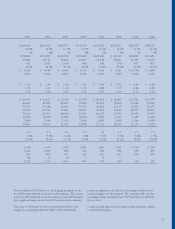
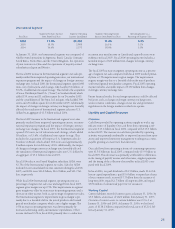
SAM’S CLUB Segment
Segment Net Sales Increase Segment Operating Segment Operating Income Operating Income as a
Fiscal Year from Prior Fiscal Year Income (in millions) Increase from Prior Fiscal Year Percentage of Segment Sales
2006 7.2% $1,385 8.2% 3.5%
2005 7.5% 1,280 13.7% 3.4%
2004 8.9% 1,126 10.1% 3.3%