Walmart 2006 Annual Report Download - page 25
Download and view the complete annual report
Please find page 25 of the 2006 Walmart annual report below. You can navigate through the pages in the report by either clicking on the pages listed below, or by using the keyword search tool below to find specific information within the annual report.-
 1
1 -
2
-
3
-
4
-
5
-
6
-
7
-
8
-
9
-
10
-
11
-
12
-
13
-
14
-
 15
15 -
 16
16 -
 17
17 -
 18
18 -
 19
19 -
 20
20 -
 21
21 -
 22
22 -
 23
23 -
 24
24 -
 25
25 -
 26
26 -
 27
27 -
 28
28 -
 29
29 -
 30
30 -
 31
31 -
 32
32 -
 33
33 -
 34
34 -
 35
35 -
36
-
37
-
38
-
39
-
40
-
41
-
42
-
43
-
44
-
45
-
46
-
47
-
48
-
49
-
50
-
51
-
52
-
53
-
54
-
55
-
56
 |
 |

23
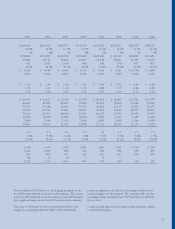
During fi scal 2006 and 2005, foreign currency exchange rates
had a $1.5 billion and $3.2 billion favorable impact, respectively,
on the International segment’s net sales, causing an increase in
the International segment’s net sales as a percentage of total net
sales relative to the Wal-Mart Stores and SAM’S CLUB segments.
Additionally, the decrease in the SAM’S CLUB segment’s net sales
as a percent of total Company sales in fi scal 2006 and 2005 when
compared to the previous fi scal years resulted from the more rapid
development of new stores in the International and Wal-Mart
Stores segments than the SAM’S CLUB segment. We expect this
trend to continue for the foreseeable future.
Our total gross profi t as a percentage of net sales (our “gross mar-
gin”) was 23.1%, 22.9% and 22.5% in fi scal 2006, 2005 and
2004, respectively. Our Wal-Mart Stores and International segment
sales yield higher gross margins than our SAM’S CLUB segment.
Accordingly, the greater increases in net sales for the Wal-Mart
Stores and International segments in fi scal 2006 and 2005 had a
favorable impact on the Company’s total gross margin.
Operating, selling, general and administrative expenses (“operat-
ing expenses”) as a percentage of net sales were 18.2%, 17.9% and
17.5% for fi scal 2006, 2005 and 2004, respectively. The increase in
operating expenses as a percentage of total net sales was primarily
due to a faster rate of growth in operating expenses in our Wal-Mart
Stores and International segments, which have higher operat-
ing expenses as a percentage of segment net sales than our SAM’S
CLUB segment. Operating expenses in fi scal 2006 were higher
as a percentage of net sales because of increases in utilities, main-
tenance and repairs and advertising. Increases in these expenses
in fi scal 2006 were partially offset by reduced payroll costs as a
percentage of net sales. Operating expenses in fi scal 2005 were
impacted by the Wal-Mart Stores and SAM’S CLUB segments’
implementation of a new job classifi cation and pay structure for
hourly fi eld associates in the United States. The job classifi cation
and pay structure, which was implemented in the second quarter
of fi scal 2005, was designed to help maintain internal equity and
external competitiveness.
Operating expenses in fi scal 2004 were impacted by the adop-
tion of Emerging Issues Task Force Issue No. 02-16, “Accounting
by a Reseller for Cash Consideration Received from a Vendor”
(“EITF 02-16”). The adoption of EITF 02-16 resulted in an
after-tax reduction in fi scal 2004 net income of approximately
$140 million.
Interest, net, as a percentage of net sales increased from fi scal 2004
through fi scal 2006. The increase was due to higher borrowing
levels and higher interest rates during the period from fi scal 2004
through fi scal 2006. The $186-million increase in interest, net, in
fi scal 2006 consisted of a $221-million increase due to higher bor-
rowing levels and $99 million due to higher interest rates, par-
tially offset by a benefi t from refund of IRS interest paid, reversal of
interest on income tax accruals for prior years, and reduced levels
of interest on fi scal 2006 income tax accruals. The $154-million
increase in interest, net, in fi scal 2005 consisted of a $139-million
increase due to higher borrowing levels, a $26-million decrease due
to changing interest rates and a $41-million increase in interest on
income tax accruals.
Our effective income tax rates for fi scal 2006, 2005 and 2004
were 33.4%, 34.7% and 36.1%, respectively. The fi scal 2006 rate
was less than the fi scal 2005 rate due primarily to adjustments
in deferred income taxes and resolutions of certain federal and
state tax contingencies. The fi scal 2005 rate was less than the fi s-
cal 2004 rate due to the October 2004 passage of the Working
Families Tax-Relief Act of 2004, which retroactively extended the
work opportunity tax credit for fi scal 2005. In addition, the fi s-
cal 2004 effective tax rate was impacted by an increase in the
deferred tax asset valuation allowance as a result of tax legislation
in Germany. This legislation required us to reevaluate the recover-
ability of deferred tax assets in Germany, resulting in a $150 mil-
lion increase in the fi scal 2004 provision for income taxes.
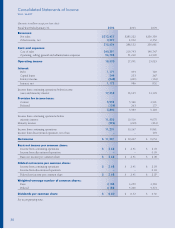
In fi scal 2006, we earned net income of $11.2 billion, a 9.4%
increase over fi scal 2005. In fi scal 2005, we earned income from
continuing operations of $10.3 billion, a 15.9% increase over fi s-
cal 2004. Net income in fi scal 2005 increased 13.4% from fi scal
2004 largely as a result of the increase in income from continuing
operations described above, net of the $193 million provided from
the discontinued operations and sale of McLane in fi scal 2004.
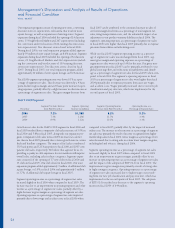
Wal-Mart Stores Segment
Segment Net Sales Increase Segment Operating Segment Operating Income Operating Income as a
Fiscal Year from Prior Fiscal Year Income (in millions) Increase from Prior Fiscal Year Percentage of Segment Sales
2006 9.4% $15,324 8.2% 7.3%
2005 10.1% 14,163 9.7% 7.4%
2004 10.9% 12,916 9.1% 7.4%
The segment net sales increases in fi scal 2006 and fi scal 2005
from the prior fi scal years resulted from comparative store sales
increases of 3.0% in fi scal 2006 and 2.9% in fi scal 2005, in addi-
tion to our expansion program. Market development strategies
in fi scal 2006 continued to put pressures on comparative stores
sales increases as new stores were opened within the trade area
of established stores. We have developed several initiatives to help
mitigate this pressure and to grow comparable store sales through
becoming more relevant to the customer by creating a better store
shopping experience, continual improvement in product assort-
ment and an aggressive store upgrade program to be instituted
over the next 18 months.