Walmart 2006 Annual Report Download - page 48
Download and view the complete annual report
Please find page 48 of the 2006 Walmart annual report below. You can navigate through the pages in the report by either clicking on the pages listed below, or by using the keyword search tool below to find specific information within the annual report.-
 1
1 -
2
-
3
-
4
-
5
-
6
-
7
-
8
-
9
-
10
-
11
-
12
-
13
-
14
-
15
-
16
-
17
-
18
-
19
-
20
-
21
-
22
-
23
-
24
-
25
-
26
-
27
-
28
-
29
-
30
-
31
-
32
-
33
-
34
-
35
-
36
-
37
-
 38
38 -
 39
39 -
 40
40 -
 41
41 -
 42
42 -
 43
43 -
 44
44 -
 45
45 -
 46
46 -
 47
47 -
 48
48 -
 49
49 -
 50
50 -
 51
51 -
 52
52 -
 53
53 -
 54
54 -
 55
55 -
 56
56
 |
 |

Notes to Consolidated Financial Statements
WAL-MART
46
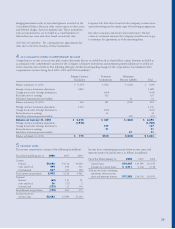
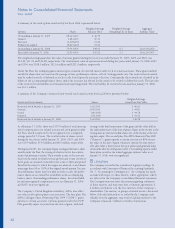
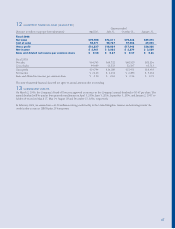
The Company measures the profi t of its segments as “segment operating income,” which is defi ned as income from continuing opera-
tions before net interest expense, income taxes and minority interest. Information on segments and the reconciliation to income from
continuing operations before income taxes and minority interest are as follows (in millions):
Fiscal Year Ended January 31, 2006 Wal-Mart Stores SAM’S CLUB International Other Consolidated
Revenues from external customers $209,910 $39,798 $62,719 $ – $312,427
Intercompany real estate charge (income) 3,454 547 – (4,001) –
Depreciation and amortization 1,922 296 1,043 1,456 4,717
Operating income (loss) 15,324 1,385 3,330 (1,509) 18,530
Interest expense, net (1,172)
Income from continuing operations before
income taxes and minority interest $ 17,358
Total assets of continuing operations $ 32,809 $ 5,686 $51,581 $48,111 $138,187
Fiscal Year Ended January 31, 2005 Wal-Mart Stores SAM’S CLUB International Other Consolidated
Revenues from external customers $ 191,826 $ 37,119 $ 56,277 $ – $ 285,222
Intercompany real estate charge (income) 2,754 513 – (3,267) –
Depreciation and amortization 1,561 274 919 1,510 4,264
Operating income (loss) 14,163 1,280 2,988 (1,340) 17,091
Interest expense, net (986)
Income from continuing operations before
income taxes and minority interest $ 16,105
Total assets of continuing operations $ 29,489 $ 5,685 $ 40,981 $ 43,999 $ 120,154
Fiscal Year Ended January 31, 2004 Wal-Mart Stores SAM’S CLUB International Other Consolidated
Revenues from external customers $ 174,220 $ 34,537 $ 47,572 $ – $ 256,329
Intercompany real estate charge (income) 2,468 484 – (2,952) –
Depreciation and amortization 1,482 249 810 1,311 3,852
Operating income (loss) 12,916 1,126 2,370 (1,387) 15,025
Interest expense, net (832)
Income from continuing operations before
income taxes and minority interest $ 14,193
Total assets of continuing operations $ 27,028 $ 4,751 $ 35,230 $ 38,396 $ 105,405
Certain information for fi scal years 2005 and 2004 has been reclassifi ed to conform to current-year presentation.
In the United States, long-lived assets, net, excluding goodwill and other assets and deferred charges were $55.5 billion and $48.4 bil-
lion as of January 31, 2006 and 2005, respectively. In the United States, additions to long-lived assets were $11.8 billion, $9.8 billion
and $8.1 billion in fi scal 2006, 2005 and 2004, respectively. Outside of the United States, long-lived assets, net, excluding goodwill and
other assets and deferred charges were $23.8 billion and $19.7 billion in fi scal 2006 and 2005, respectively. Outside of the United
States, additions to long-lived assets were $2.8 billion, $3.1 billion and $2.2 billion in fi scal 2006, 2005 and 2004, respectively. The
International segment includes all real estate outside the United States. The operations of the Company’s ASDA subsidiary are signifi cant
in comparison to the total operations of the International segment. ASDA sales during fi scal 2006, 2005 and 2004 were $26.8 billion,
$26.0 billion and $21.7 billion, respectively. At January 31, 2006 and 2005, ASDA long-lived assets, consisting primarily of property and
equipment, net, and goodwill, net, totaled $17.7 billion and $18.9 billion, respectively. The decline in ASDA’s long-lived assets from
January 31, 2005 to January 31, 2006 was largely due to foreign currency translation.