Walmart 2006 Annual Report Download - page 34
Download and view the complete annual report
Please find page 34 of the 2006 Walmart annual report below. You can navigate through the pages in the report by either clicking on the pages listed below, or by using the keyword search tool below to find specific information within the annual report.-
 1
1 -
2
-
3
-
4
-
5
-
6
-
7
-
8
-
9
-
10
-
11
-
12
-
13
-
14
-
15
-
16
-
17
-
18
-
19
-
20
-
21
-
22
-
23
-
 24
24 -
 25
25 -
 26
26 -
 27
27 -
 28
28 -
 29
29 -
 30
30 -
 31
31 -
 32
32 -
 33
33 -
 34
34 -
 35
35 -
 36
36 -
 37
37 -
 38
38 -
 39
39 -
 40
40 -
 41
41 -
 42
42 -
 43
43 -
 44
44 -
45
-
46
-
47
-
48
-
49
-
50
-
51
-
52
-
53
-
54
-
55
-
56
 |
 |

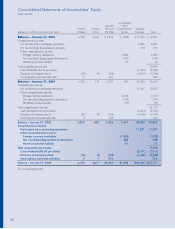
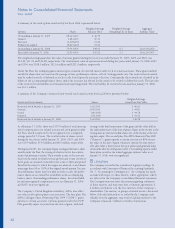
Consolidated Statements of Shareholders’ Equity
WAL-MART
Accumulated
Capital in Other
Number Common Excess of Comprehensive Retained
(Amounts in millions except per share data) of Shares Stock Par Value Income Earnings Total
Balance – January 31, 2003 4,395 $ 440 $ 1,954 $ (509) $ 37,576 $ 39,461
Comprehensive income:
Net income from continuing operations 8,861 8,861
Net income from discontinued operation 193 193
Other comprehensive income:
Foreign currency translation 1,685 1,685
Net unrealized depreciation of derivatives (341) (341)
Minimum pension liability 16 16
Total comprehensive income 10,414
Cash dividends ($0.36 per share) (1,569) (1,569)
Purchase of Company stock (92) (9) (182) (4,855) (5,046)
Stock options exercised and other 8 363 363
Balance – January 31, 2004 4,311 431 2,135 851 40,206 43,623
Comprehensive income:
Net income from continuing operations 10,267 10,267
Other comprehensive income:
Foreign currency translation 2,130 2,130
Net unrealized depreciation of derivatives (194) (194)
Minimum pension liability (93) (93)
Total comprehensive income 12,110
Cash dividends ($0.52 per share) (2,214) (2,214)
Purchase of Company stock (81) (8) (136) (4,405) (4,549)
Stock options exercised and other 4 426 426
Balance – January 31, 2005 4,234 423 2,425 2,694 43,854 49,396
Comprehensive income:
Net income from continuing operations 11,231 11,231
Other comprehensive income:
Foreign currency translation (1,920) (1,920)
Net unrealized depreciation of derivatives 228 228
Minimum pension liability 51 51
Total comprehensive income 9,590
Cash dividends ($0.60 per share) (2,511) (2,511)
Purchase of Company stock (74) (7) (104) (3,469) (3,580)
Stock options exercised and other 5 1 275 276
Balance – January 31, 2006 4,165 $417 $2,596 $1,053 $49,105 $53,171
See accompanying notes.
32