Walmart 2006 Annual Report Download - page 27
Download and view the complete annual report
Please find page 27 of the 2006 Walmart annual report below. You can navigate through the pages in the report by either clicking on the pages listed below, or by using the keyword search tool below to find specific information within the annual report.-
 1
1 -
2
-
3
-
4
-
5
-
6
-
7
-
8
-
9
-
10
-
11
-
12
-
13
-
14
-
15
-
16
-
 17
17 -
 18
18 -
 19
19 -
 20
20 -
 21
21 -
 22
22 -
 23
23 -
 24
24 -
 25
25 -
 26
26 -
 27
27 -
 28
28 -
 29
29 -
 30
30 -
 31
31 -
 32
32 -
 33
33 -
 34
34 -
 35
35 -
 36
36 -
 37
37 -
38
-
39
-
40
-
41
-
42
-
43
-
44
-
45
-
46
-
47
-
48
-
49
-
50
-
51
-
52
-
53
-
54
-
55
-
56
 |
 |

25
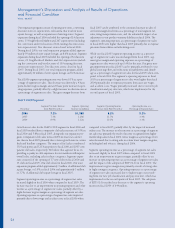
International Segment
Segment Net Sales Increase Segment Operating Segment Operating Income Operating Income as a
Fiscal Year from Prior Fiscal Year Income (in millions) Increase from Prior Fiscal Year Percentage of Segment Sales
2006 11.4% $3,330 11.4% 5.3%
2005 18.3% 2,988 26.1% 5.3%
2004 16.6% 2,370 18.6% 5.0%
At January 31, 2006, our International segment was comprised of
wholly-owned operations in Argentina, Brazil, Canada, Germany,
South Korea, Puerto Rico and the United Kingdom, the operation
of joint ventures in China and the operations of majority-owned
subsidiaries in Japan and Mexico.
The fi scal 2006 increase in the International segment’s net sales pri-
marily resulted from improved operating execution, our international
expansion program and the impact of changes in foreign currency
exchange rates. In fi scal 2006, the International segment opened 698
units, net of relocations and closings, which added 52 million, or
39.2%, of additional unit square footage. This includes the acquisition
of Sonae Distribuição Brasil S.A. (“Sonae”) in Southern Brazil, which
added 139 stores and 11 million square feet in December 2005,
and the consolidation of The Seiyu, Ltd. in Japan, which added 398
stores and 29 million square feet in December 2005. Additionally,
the impact of changes in foreign currency exchange rates favorably
affected the translation of International segment sales into U.S.
dollars by an aggregate of $1.5 billion in fi scal 2006.
The fi scal 2005 increase in the International segment’s net sales
primarily resulted from improved operating execution, our inter-
national expansion program and the impact of foreign currency
exchange rate changes. In fi scal 2005, the International segment
opened 232 units, net of relocations and closings, which added
18 million, or 15.6%, of additional unit square footage. This
includes the acquisition of Bompreço S.A. Supermercados do
Nordeste in Brazil, which added 118 stores and approximately
8 million square feet in February 2004. Additionally, the impact
of changes in foreign currency exchange rates favorably affected
the translation of International segment sales into U.S. dollars by
an aggregate of $3.2 billion in fi scal 2005.
Fiscal 2006 sales at our United Kingdom subsidiary, ASDA, were
42.7% of the International segment net sales. Sales for ASDA
included in our consolidated income statement during fi scal 2006,
2005, and 2004 were $26.8 billion, $26.0 billion, and $21.7 bil-
lion, respectively.
While fi scal 2006 International segment operating income as a
percentage of segment net sales was unchanged from fi scal 2005,
segment gross margin was up 0.5%. This improvement in segment
gross margin was offset by an increase in operating expenses and a
decrease in other income, both as a percentage of segment net sales.
The International segment’s improvement in gross margin is pri-
marily due to a favorable shift in the mix of products sold toward
general merchandise categories which carry a higher margin. The
0.3% increase in operating expenses was driven primarily by
increased advertising, utility and insurance expenditures. Other
income declined 0.2% in fi scal 2006 primarily due to a reduction
in current year rental income in Canada and a payroll tax recovery
in Mexico in fi scal 2005. Fiscal 2006 operating income includes a
favorable impact of $64 million from changes in foreign currency
exchange rates.
The fi scal 2005 increase in segment operating income as a percent-
age of segment net sales compared with fi scal 2004 resulted primar-
ily from a 0.3% improvement in gross margin. The improvement
in gross margin was due to a favorable shift in the mix of products
sold toward general merchandise categories. Fiscal 2005 operating
income includes a favorable impact of $150 million from changes
in foreign currency exchange rates.
Future fi nancial results for our foreign operations could be affected
by factors such as changes in foreign currency exchange rates,
weak economic conditions, changes in tax law and government
regulations in the foreign markets in which we operate.
Liquidity and Capital Resources
Overview
Cash fl ows provided by operating activities supply us with a sig-
nifi cant source of liquidity. Our cash fl ows from operating activi-
ties were $17.6 billion in fi scal 2006 compared with $15.0 billion
in fi scal 2005. The increase in cash fl ows provided by operating
activities was primarily attributable to improved income from oper-
ations and improved inventory management resulting in accounts
payable growing at a faster rate than inventory.
Our cash fl ows from operating activities of continuing operations
were $15.0 billion in fi scal 2005, compared with $15.9 billion in
fi scal 2004. This decrease was primarily attributable to differences
in the timing of payroll, income and other taxes, supplier payments
and the timing of the collection of receivables in fi scal 2005 com-
pared with fi scal 2004.
In fi scal 2006, we paid dividends of $2.5 billion, made $14.6 bil-
lion in capital expenditures, paid $3.6 billion to repurchase shares
of our common stock, received $7.7 billion from the issuance of
long-term debt, repaid $2.7 billion of long-term debt and repaid
$704 million of commercial paper (net of issuances).
Working Capital
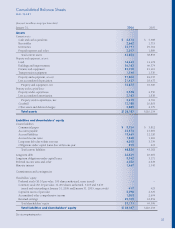
Current liabilities exceeded current assets at January 31, 2006, by
$5.0 billion, an increase of $622 million from January 31, 2005.
Our ratio of current assets to current liabilities was 0.9 to 1 at
January 31, 2006 and 2005. At January 31, 2006, we had total
assets of $138.2 billion compared with total assets of $120.2 bil-
lion at January 31, 2005.