Yahoo 2001 Annual Report Download - page 15
Download and view the complete annual report
Please find page 15 of the 2001 Yahoo annual report below. You can navigate through the pages in the report by either clicking on the pages listed below, or by using the keyword search tool below to find specific information within the annual report.-
 1
1 -
2
-
3
-
4
-
 5
5 -
 6
6 -
 7
7 -
 8
8 -
 9
9 -
 10
10 -
 11
11 -
 12
12 -
 13
13 -
 14
14 -
 15
15 -
 16
16 -
 17
17 -
 18
18 -
 19
19 -
 20
20 -
 21
21 -
 22
22 -
 23
23 -
 24
24 -
 25
25 -
26
-
27
-
28
-
29
-
30
-
31
-
32
-
33
-
34
-
35
-
36
-
37
-
38
-
39
 |
 |

YHOO27YHOO26
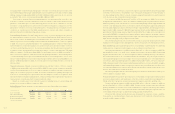
27. Selected financial data
28. Management’s discussion and analysis
43. Consolidated statements of operations
44. Consolidated balance sheets
45. Consolidated statements of cash flows
46. Consolidated statements of stockholders’ equity
47. Notes to consolidated financial statements
67. Report of independent accountants
68. Quarterly financial data (unaudited)
69. Corporate information
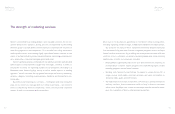
Most significantly, we did all of this while maintaining pro forma EBITDA*profitability in every quarter. Pro
forma EBITDA in fiscal 2001 was $43.6 million compared to pro forma EBITDA of $410.6 million in fiscal 2000.
On a GAAP basis, the net loss for fiscal year 2001, which included $62.2 million of restructuring and acquisi-
tion-related costs, was $92.8 million or $0.16 loss per diluted share. This compares to GAAP net income of
$70.8 million or $0.12 per diluted share for fiscal year 2000, including $22.8 million of acquisition-related costs.
Our balance sheet remains strong with cash and marketable securities totaling almost $1.5 billion at
December 2001. We expect our balance sheet to be a key resource as we execute on our objective to selec-
tively pursue acquisitions and partnerships.
Importantly, Yahoo! will continue to operate in a financially disciplined manner as we manage through the
ongoing challenging economic environment. We believe that this discipline has positioned us well for future
growth. On the surface, our results from one quarter to the next in 2001 demonstrated broad stability on the
top and bottom lines. Beneath the surface, many financial changes were taking place: the composition of our
client base is now significantly higher quality and more diverse in nature, we tightened the criteria for making
equity investments in companies and disposed of most of our non-strategic positions. We believe we have cre-
ated a strong foundation that will serve as a platform to permit us to drive profitable growth in the years ahead.
Financial table of contents
*Pro forma EBITDA is defined as earnings before interest, taxes, depreciation, amortization, acquisition related costs, stock compensation expenses and
restructuring charges.
Years Ended December 31, (in thousands, except per share amounts) 2001 2000 1999 1998 1997
Net revenues $ 717,422 $1,110,178 $ 591,786 $245,132 $ 84,108
Net income (loss) (92,788) 70,776 47,811 (13,641) (43,376)
Net income (loss) per share – basic $ (0.16) $ 0.13 $ 0.09 $ (0.03) $ (0.11)
Net income (loss) per share – diluted $ (0.16) $ 0.12 $ 0.08 $ (0.03) $ (0.11)
Shares used in per share
calculation – basic 569,724 550,657 516,237 440,131 391,542
Shares used in per share
calculation – diluted 569,724 610,678 599,558 440,131 391,542
December 31, 2001 2000 1999 1998 1997
Cash, cash equivalents and
investments in marketable
debt securities $1,471,993 $1,658,666 $1,004,300 $636,079 $136,581
Restricted cash and restricted
long-term investments 258,662 30,000 — — —
Working capital 693,016 979,635 796,653 531,032 136,714
Total assets 2,379,346 2,269,576 1,520,129 790,471 203,351
Mandatorily redeemable convertible
preferred stock —— 52,173 9,923 —
Stockholders’ equity $1,967,017 $1,896,914 $1,251,732 $676,361 $137,241
Selected financial data