Freddie Mac 2014 Annual Report Download - page 205
Download and view the complete annual report
Please find page 205 of the 2014 Freddie Mac annual report below. You can navigate through the pages in the report by either clicking on the pages listed below, or by using the keyword search tool below to find specific information within the annual report.-
 1
1 -
2
-
3
-
4
-
5
-
6
-
7
-
8
-
9
-
10
-
11
-
12
-
13
-
14
-
15
-
16
-
17
-
18
-
19
-
20
-
21
-
22
-
23
-
24
-
25
-
26
-
27
-
28
-
29
-
30
-
31
-
32
-
33
-
34
-
35
-
36
-
37
-
38
-
39
-
40
-
41
-
42
-
43
-
44
-
45
-
46
-
47
-
48
-
49
-
50
-
51
-
52
-
53
-
54
-
55
-
56
-
57
-
58
-
59
-
60
-
61
-
62
-
63
-
64
-
65
-
66
-
67
-
68
-
69
-
70
-
71
-
72
-
73
-
74
-
75
-
76
-
77
-
78
-
79
-
80
-
81
-
82
-
83
-
84
-
85
-
86
-
87
-
88
-
89
-
90
-
91
-
92
-
93
-
94
-
95
-
96
-
97
-
98
-
99
-
100
-
101
-
102
-
103
-
104
-
105
-
106
-
107
-
108
-
109
-
110
-
111
-
112
-
113
-
114
-
115
-
116
-
117
-
118
-
119
-
120
-
121
-
122
-
123
-
124
-
125
-
126
-
127
-
128
-
129
-
130
-
131
-
132
-
133
-
134
-
135
-
136
-
137
-
138
-
139
-
140
-
141
-
142
-
143
-
144
-
145
-
146
-
147
-
148
-
149
-
150
-
151
-
152
-
153
-
154
-
155
-
156
-
157
-
158
-
159
-
160
-
161
-
162
-
163
-
164
-
165
-
166
-
167
-
168
-
169
-
170
-
171
-
172
-
173
-
174
-
175
-
176
-
177
-
178
-
179
-
180
-
181
-
182
-
183
-
184
-
185
-
186
-
187
-
188
-
189
-
190
-
191
-
192
-
193
-
194
-
 195
195 -
 196
196 -
 197
197 -
 198
198 -
 199
199 -
 200
200 -
 201
201 -
 202
202 -
 203
203 -
 204
204 -
 205
205 -
 206
206 -
 207
207 -
 208
208 -
 209
209 -
 210
210 -
 211
211 -
 212
212 -
 213
213 -
 214
214 -
 215
215 -
216
-
217
-
218
-
219
-
220
-
221
-
222
-
223
-
224
-
225
-
226
-
227
-
228
-
229
-
230
-
231
-
232
-
233
-
234
-
235
-
236
-
237
-
238
-
239
-
240
-
241
-
242
-
243
-
244
-
245
-
246
-
247
-
248
-
249
-
250
-
251
-
252
-
253
-
254
-
255
-
256
-
257
-
258
-
259
-
260
-
261
-
262
-
263
-
264
-
265
-
266
-
267
-
268
-
269
-
270
-
271
-
272
-
273
-
274
-
275
-
276
-
277
-
278
-
279
-
280
-
281
-
282
-
283
-
284
-
285
-
286
-
287
-
288
-
289
-
290
-
291
-
292
-
293
-
294
-
295
-
296
-
297
-
298
-
299
-
300
-
301
-
302
-
303
-
304
-
305
-
306
-
307
-
308
-
309
-
310
-
311
-
312
-
313
-
314
-
315
-
316
-
317
-
318
-
319
-
320
-
321
-
322
-
323
-
324
-
325
-
326
-
327
-
328
-
329
-
330
 |
 |

200 Freddie Mac
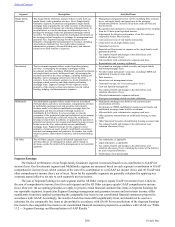
Segment Description Activities/Items
Single-family
Guarantee The Single-family Guarantee segment reflects results from our
single-family credit guarantee activities. In our Single-family
Guarantee segment, we purchase and guarantee single-family
mortgage loans originated by our seller/servicers in the primary
mortgage market and manage our seriously delinquent loans. In
most instances, we use the mortgage securitization process to
package the mortgage loans into guaranteed mortgage-related
securities. We guarantee the payment of principal and interest on
the mortgage-related securities in exchange for management and
guarantee fees. Segment Earnings for this segment consist
primarily of management and guarantee fee revenues, including
amortization of upfront fees, less credit-related expenses,
administrative expenses, allocated funding costs, and amounts
related to net float benefits or expenses.
• Management and guarantee fees on PCs, including those retained
by us, and single-family mortgage loans in the mortgage
investments portfolio, inclusive of up-front credit delivery and
buy-down fees
• Recognition and remittance to Treasury of guarantee fees resulting
from the 10 basis point legislated increase
• Adjustments for the price performance of our PCs relative to
comparable Fannie Mae securities
• Costs and recoveries of risk transfer transactions
• Credit losses on all single-family assets
• Guarantee buy-downs
• Expected net float income or expense on the single-family credit
guarantee portfolio
• Tax expense/benefit and changes in the deferred tax asset
valuation allowance (if any)
• Allocated debt costs, administrative expenses and taxes
• Representation and warranty settlements
Investments The Investments segment reflects results from three primary
activities: (a) managing the company’s mortgage-related
investments portfolio, excluding Multifamily segment investments
and single-family seriously delinquent loans; (b) managing the
treasury function for the entire company, including funding and
liquidity; and (c) managing interest-rate risk for the entire
company. In our Investments segment, we invest principally in
mortgage-related securities and single-family performing
mortgage loans. Segment Earnings for this segment consist
primarily of the returns on these investments, less the related
funding, hedging, and administrative expenses.
• Investments in mortgage-related securities and single-family
performing mortgage loans
• All other traded instruments / securities, excluding CMBS and
multifamily housing revenue bonds
• Debt issuances
• Interest rate risk management returns
• Guarantee buy-ups, net of execution gains / losses
• Cash and liquidity management
• Tax expense/benefit and changes in the deferred tax asset
valuation allowance (if any)
• Allocated administrative expenses and taxes
• Non-agency mortgage-related securities settlements
Multifamily The Multifamily segment reflects results from our investment
(both purchases and sales), securitization, and guarantee activities
in multifamily mortgage loans and securities. Our primary
business model is to purchase multifamily mortgage loans for
aggregation and then securitization through issuance of
multifamily K Certificates. To a lesser extent, we provide
guarantees of the payment of principal and interest on tax-exempt
multifamily pass-through certificates backed by multifamily
housing revenue bonds. In addition, we guarantee the payment of
principal and interest on tax-exempt multifamily housing revenue
bonds secured by low- and moderate-income multifamily
mortgage loans. Segment Earnings for this segment consist
primarily of returns on assets related to multifamily investment
activities and management and guarantee fee income, less credit-
related expenses, administrative expenses, and allocated funding
costs.
• Multifamily mortgage loans held-for-sale and associated
securitization activities
• Investments in CMBS, multifamily housing revenue bonds, and
multifamily mortgage loans held-for-investment
• Allocated debt costs, administrative expenses and taxes
• Other guarantee commitments on multifamily housing revenue
bonds
• Other Structured Securities of multifamily housing revenue bonds
• Tax expense/benefit and changes in the deferred tax asset
valuation allowance (if any)
All Other The All Other category consists of material corporate-level
activities that are: (a) infrequent in nature; and (b) based on
decisions outside the control of the management of our reportable
segments.
• Tax settlements, as applicable
• Legal settlements, as applicable
• Tax expense/benefit and changes in the deferred tax asset
valuation allowance (if any), including the release of the deferred
tax asset valuation allowance
• Termination of our pension plan
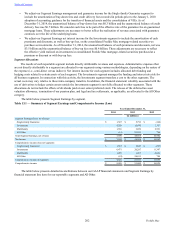
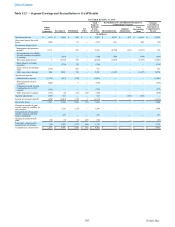
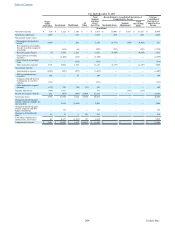
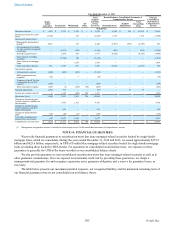
Segment Earnings
The financial performance of our Single-family Guarantee segment is measured based on its contribution to GAAP net
income (loss). Our Investments segment and Multifamily segment are measured based on each segment's contribution to GAAP
comprehensive income (loss), which consists of the sum of its contribution to: (a) GAAP net income (loss); and (b) GAAP total
other comprehensive income (loss), net of taxes. Taxes for the reportable segments are generally calculated by applying our
corporate annual effective tax rate to each segment's pre-tax income.
The sum of Segment Earnings for each segment and the All Other category equals GAAP net income (loss). Likewise,
the sum of comprehensive income (loss) for each segment and the All Other category equals GAAP comprehensive income
(loss). However, the accounting principles we apply to present certain financial statement line items in Segment Earnings for
our reportable segments, in particular Segment Earnings management and guarantee income and net interest income, differ
significantly from those applied in preparing the comparable line items in our consolidated financial statements prepared in
accordance with GAAP. Accordingly, the results of such line items differ significantly from, and should not be used as a
substitute for, the comparable line items as determined in accordance with GAAP. For reconciliations of the Segment Earnings
line items to the comparable line items in our consolidated financial statements prepared in accordance with GAAP, see “Table
13.2 — Segment Earnings and Reconciliation to GAAP Results.”
Table of Contents