Freddie Mac 2014 Annual Report Download - page 222
Download and view the complete annual report
Please find page 222 of the 2014 Freddie Mac annual report below. You can navigate through the pages in the report by either clicking on the pages listed below, or by using the keyword search tool below to find specific information within the annual report.-
 1
1 -
2
-
3
-
4
-
5
-
6
-
7
-
8
-
9
-
10
-
11
-
12
-
13
-
14
-
15
-
16
-
17
-
18
-
19
-
20
-
21
-
22
-
23
-
24
-
25
-
26
-
27
-
28
-
29
-
30
-
31
-
32
-
33
-
34
-
35
-
36
-
37
-
38
-
39
-
40
-
41
-
42
-
43
-
44
-
45
-
46
-
47
-
48
-
49
-
50
-
51
-
52
-
53
-
54
-
55
-
56
-
57
-
58
-
59
-
60
-
61
-
62
-
63
-
64
-
65
-
66
-
67
-
68
-
69
-
70
-
71
-
72
-
73
-
74
-
75
-
76
-
77
-
78
-
79
-
80
-
81
-
82
-
83
-
84
-
85
-
86
-
87
-
88
-
89
-
90
-
91
-
92
-
93
-
94
-
95
-
96
-
97
-
98
-
99
-
100
-
101
-
102
-
103
-
104
-
105
-
106
-
107
-
108
-
109
-
110
-
111
-
112
-
113
-
114
-
115
-
116
-
117
-
118
-
119
-
120
-
121
-
122
-
123
-
124
-
125
-
126
-
127
-
128
-
129
-
130
-
131
-
132
-
133
-
134
-
135
-
136
-
137
-
138
-
139
-
140
-
141
-
142
-
143
-
144
-
145
-
146
-
147
-
148
-
149
-
150
-
151
-
152
-
153
-
154
-
155
-
156
-
157
-
158
-
159
-
160
-
161
-
162
-
163
-
164
-
165
-
166
-
167
-
168
-
169
-
170
-
171
-
172
-
173
-
174
-
175
-
176
-
177
-
178
-
179
-
180
-
181
-
182
-
183
-
184
-
185
-
186
-
187
-
188
-
189
-
190
-
191
-
192
-
193
-
194
-
195
-
196
-
197
-
198
-
199
-
200
-
201
-
202
-
203
-
204
-
205
-
206
-
207
-
208
-
209
-
210
-
211
-
 212
212 -
 213
213 -
 214
214 -
 215
215 -
 216
216 -
 217
217 -
 218
218 -
 219
219 -
 220
220 -
 221
221 -
 222
222 -
 223
223 -
 224
224 -
 225
225 -
 226
226 -
 227
227 -
 228
228 -
 229
229 -
 230
230 -
 231
231 -
 232
232 -
233
-
234
-
235
-
236
-
237
-
238
-
239
-
240
-
241
-
242
-
243
-
244
-
245
-
246
-
247
-
248
-
249
-
250
-
251
-
252
-
253
-
254
-
255
-
256
-
257
-
258
-
259
-
260
-
261
-
262
-
263
-
264
-
265
-
266
-
267
-
268
-
269
-
270
-
271
-
272
-
273
-
274
-
275
-
276
-
277
-
278
-
279
-
280
-
281
-
282
-
283
-
284
-
285
-
286
-
287
-
288
-
289
-
290
-
291
-
292
-
293
-
294
-
295
-
296
-
297
-
298
-
299
-
300
-
301
-
302
-
303
-
304
-
305
-
306
-
307
-
308
-
309
-
310
-
311
-
312
-
313
-
314
-
315
-
316
-
317
-
318
-
319
-
320
-
321
-
322
-
323
-
324
-
325
-
326
-
327
-
328
-
329
-
330
 |
 |

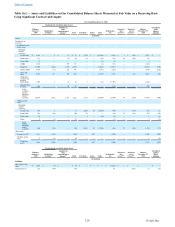
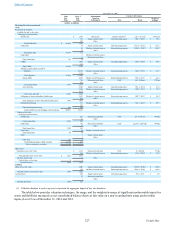
217 Freddie Mac
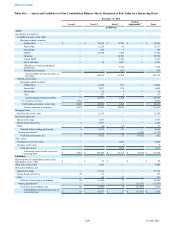
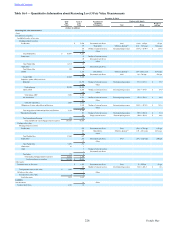
Fair Value at December 31, 2013
Level 1 Level 2 Level 3 Netting
Adjustment(1) Total
(in millions)
Assets:
Investments in securities:
Available-for-sale, at fair value:
Mortgage-related securities:
Freddie Mac $ — $ 38,720 $ 1,939 $ — $ 40,659
Fannie Mae — 10,666 131 — 10,797
Ginnie Mae — 155 12 — 167
CMBS — 27,229 3,109 — 30,338
Subprime — — 27,499 — 27,499
Option ARM — — 6,574 — 6,574
Alt-A and other — — 8,706 — 8,706
Obligations of states and political
subdivisions — — 3,495 — 3,495
Manufactured housing — — 684 — 684
Total available-for-sale securities, at
fair value — 76,770 52,149 — 128,919
Trading, at fair value:
Mortgage-related securities:
Freddie Mac — 9,006 343 — 9,349
Fannie Mae — 6,959 221 — 7,180
Ginnie Mae — 24 74 — 98
Other — 133 8 — 141
Total mortgage-related securities — 16,122 646 — 16,768
U.S. Treasury securities 6,636 — — — 6,636
Total trading securities, at fair value 6,636 16,122 646 — 23,404
Total investments in securities 6,636 92,892 52,795 — 152,323
Mortgage loans:
Held-for-sale, at fair value — 8,727 — — 8,727
Derivative assets, net:
Interest-rate swaps — 10,009 10 — 10,019
Option-based derivatives — 4,112 — — 4,112
Other — 99 1 — 100
Subtotal, before netting adjustments — 14,220 11 — 14,231
Netting adjustments(1) — — — (13,168) (13,168)
Total derivative assets, net — 14,220 11 (13,168) 1,063
Other assets:
Guarantee asset, at fair value — — 1,611 — 1,611
All other, at fair value — — 9 — 9
Total other assets — — 1,620 — 1,620
Total assets carried at fair value on a
recurring basis $ 6,636 $ 115,839 $ 54,426 $ (13,168) $ 163,733
Liabilities:
Debt securities of consolidated trusts held by
third parties, at fair value $ — $ 59 $ — $ — $ 59
Other debt, at fair value — 1,155 1,528 — 2,683
Derivative liabilities, net:
Interest-rate swaps — 13,022 295 — 13,317
Option-based derivatives — 201 3 — 204
Other — 68 38 — 106
Subtotal, before netting adjustments — 13,291 336 — 13,627
Netting adjustments(1) — — — (13,447) (13,447)
Total derivative liabilities, net — 13,291 336 (13,447) 180
Total liabilities carried at fair value on
a recurring basis $ — $ 14,505 $ 1,864 $ (13,447) $ 2,922
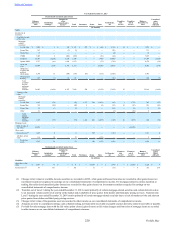
(1) Represents counterparty netting, cash collateral netting and net derivative interest receivable or payable. The net cash collateral posted was $3.2 billion
and $871 million, respectively, at December 31, 2014 and 2013. The net interest receivable (payable) of derivative assets and derivative liabilities was
$(0.7) billion and $(0.6) billion at December 31, 2014 and 2013, respectively, which was mainly related to interest rate swaps.
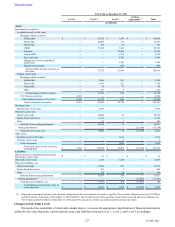
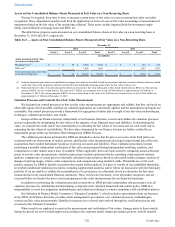
Changes in Fair Value Levels
We monitor the availability of observable market data to: (a) assess the appropriate classification of financial instruments
within the fair value hierarchy; and (b) transfer assets and liabilities between Level 1, Level 2, and Level 3 accordingly.
Table of Contents