Freddie Mac 2014 Annual Report Download - page 92
Download and view the complete annual report
Please find page 92 of the 2014 Freddie Mac annual report below. You can navigate through the pages in the report by either clicking on the pages listed below, or by using the keyword search tool below to find specific information within the annual report.-
 1
1 -
2
-
3
-
4
-
5
-
6
-
7
-
8
-
9
-
10
-
11
-
12
-
13
-
14
-
15
-
16
-
17
-
18
-
19
-
20
-
21
-
22
-
23
-
24
-
25
-
26
-
27
-
28
-
29
-
30
-
31
-
32
-
33
-
34
-
35
-
36
-
37
-
38
-
39
-
40
-
41
-
42
-
43
-
44
-
45
-
46
-
47
-
48
-
49
-
50
-
51
-
52
-
53
-
54
-
55
-
56
-
57
-
58
-
59
-
60
-
61
-
62
-
63
-
64
-
65
-
66
-
67
-
68
-
69
-
70
-
71
-
72
-
73
-
74
-
75
-
76
-
77
-
78
-
79
-
80
-
81
-
 82
82 -
 83
83 -
 84
84 -
 85
85 -
 86
86 -
 87
87 -
 88
88 -
 89
89 -
 90
90 -
 91
91 -
 92
92 -
 93
93 -
 94
94 -
 95
95 -
 96
96 -
 97
97 -
 98
98 -
 99
99 -
 100
100 -
 101
101 -
 102
102 -
103
-
104
-
105
-
106
-
107
-
108
-
109
-
110
-
111
-
112
-
113
-
114
-
115
-
116
-
117
-
118
-
119
-
120
-
121
-
122
-
123
-
124
-
125
-
126
-
127
-
128
-
129
-
130
-
131
-
132
-
133
-
134
-
135
-
136
-
137
-
138
-
139
-
140
-
141
-
142
-
143
-
144
-
145
-
146
-
147
-
148
-
149
-
150
-
151
-
152
-
153
-
154
-
155
-
156
-
157
-
158
-
159
-
160
-
161
-
162
-
163
-
164
-
165
-
166
-
167
-
168
-
169
-
170
-
171
-
172
-
173
-
174
-
175
-
176
-
177
-
178
-
179
-
180
-
181
-
182
-
183
-
184
-
185
-
186
-
187
-
188
-
189
-
190
-
191
-
192
-
193
-
194
-
195
-
196
-
197
-
198
-
199
-
200
-
201
-
202
-
203
-
204
-
205
-
206
-
207
-
208
-
209
-
210
-
211
-
212
-
213
-
214
-
215
-
216
-
217
-
218
-
219
-
220
-
221
-
222
-
223
-
224
-
225
-
226
-
227
-
228
-
229
-
230
-
231
-
232
-
233
-
234
-
235
-
236
-
237
-
238
-
239
-
240
-
241
-
242
-
243
-
244
-
245
-
246
-
247
-
248
-
249
-
250
-
251
-
252
-
253
-
254
-
255
-
256
-
257
-
258
-
259
-
260
-
261
-
262
-
263
-
264
-
265
-
266
-
267
-
268
-
269
-
270
-
271
-
272
-
273
-
274
-
275
-
276
-
277
-
278
-
279
-
280
-
281
-
282
-
283
-
284
-
285
-
286
-
287
-
288
-
289
-
290
-
291
-
292
-
293
-
294
-
295
-
296
-
297
-
298
-
299
-
300
-
301
-
302
-
303
-
304
-
305
-
306
-
307
-
308
-
309
-
310
-
311
-
312
-
313
-
314
-
315
-
316
-
317
-
318
-
319
-
320
-
321
-
322
-
323
-
324
-
325
-
326
-
327
-
328
-
329
-
330
 |
 |
87 Freddie Mac
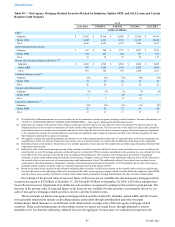
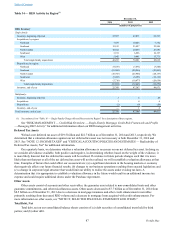
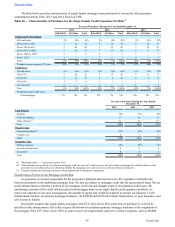
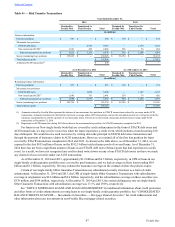
Table 34 — REO Activity by Region(1)
December 31,
2014 2013 2012
(number of properties)
REO Inventory
Single-family:
Inventory, beginning of period 47,307 49,071 60,535
Acquisitions, by region:
Northeast 7,657 10,023 7,352
Southeast 15,183 23,827 23,906
North Central 10,662 20,834 27,586
Southwest 3,721 6,996 10,197
West 5,042 9,001 13,771
Total single-family acquisitions 42,265 70,681 82,812
Dispositions, by region:
Northeast (9,435) (7,071) (7,544)
Southeast (21,969) (20,956) (25,803)
North Central (18,785) (25,946) (28,137)
Southwest (5,905) (8,395) (12,134)
West (7,710) (10,077) (20,658)
Total single-family dispositions (63,804) (72,445) (94,276)
Inventory, end of year 25,768 47,307 49,071
Multifamily:
Inventory, beginning of period 1 6 20
Acquisitions 1 4 6
Dispositions (2) (9) (20)
Inventory, end of year — 1 6
Total inventory, end of year 25,768 47,308 49,077
(1) See endnote (1) to “Table 16 — Single-Family Charge-offs and Recoveries by Region” for a description of these regions.
See “RISK MANAGEMENT — Credit Risk Overview — Single-Family Mortgage Credit Risk Framework and Profile
— Managing REO Activity” for additional information about our REO management activities.
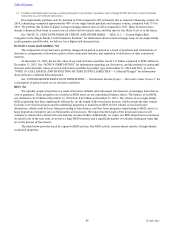
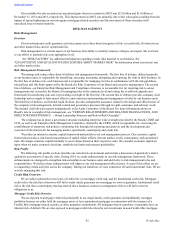
Deferred Tax Assets
We had a net deferred tax asset of $19.5 billion and $22.7 billion as of December 31, 2014 and 2013, respectively. We
determined that a valuation allowance against our net deferred tax asset was not necessary at both December 31, 2014 and
2013. See "NOTE 12: INCOME TAXES" and "CRITICAL ACCOUTING POLICIES AND ESTIMATES — Realizability of
Deferred Tax Assets, Net" for additional information.
On a quarterly basis, we determine whether a valuation allowance is necessary on our net deferred tax asset. In doing so,
we consider all evidence available, both positive and negative, in determining whether, based on the weight of the evidence, it
is more likely than not that the deferred tax assets will be realized. If evidence in future periods changes such that it is more
likely than not that part or all of the net deferred tax asset will not be realized, we will reestablish a valuation allowance at that
time. Examples of factors that could affect our assessment are: (a) a significant downturn in the housing markets or economy
that negatively affects our future financial results; (b) changes to our business operations resulting from enacted legislation; and
(c) a change in corporate legal structure that would limit our ability to realize the assets under existing tax laws. A
determination that it is appropriate to establish a valuation allowance in the future would result in an additional income tax
expense and could require additional draws under the Purchase Agreement.
Other Assets
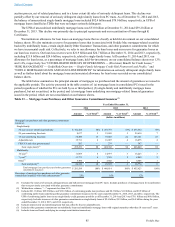
Other assets consist of accounts and other receivables, the guarantee asset related to non-consolidated trusts and other
guarantee commitments, and other miscellaneous assets. Other assets decreased to $7.7 billion as of December 31, 2014 from
$8.5 billion as of December 31, 2013 due to a decrease in mortgage insurance and other credit enhancement receivables
primarily resulting from decreased REO volume and a decrease in mortgage loans acquired with credit enhancements. For
more information on other assets, see “NOTE 19: SELECTED FINANCIAL STATEMENT LINE ITEMS.”
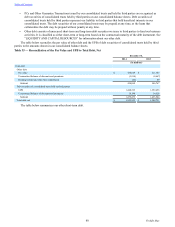
Total Debt, Net
Total debt, net on our consolidated balance sheets consists of: (a) debt securities of consolidated trusts held by third
parties; and (b) other debt.
Table of Contents