Freddie Mac 2014 Annual Report Download - page 226
Download and view the complete annual report
Please find page 226 of the 2014 Freddie Mac annual report below. You can navigate through the pages in the report by either clicking on the pages listed below, or by using the keyword search tool below to find specific information within the annual report.-
 1
1 -
2
-
3
-
4
-
5
-
6
-
7
-
8
-
9
-
10
-
11
-
12
-
13
-
14
-
15
-
16
-
17
-
18
-
19
-
20
-
21
-
22
-
23
-
24
-
25
-
26
-
27
-
28
-
29
-
30
-
31
-
32
-
33
-
34
-
35
-
36
-
37
-
38
-
39
-
40
-
41
-
42
-
43
-
44
-
45
-
46
-
47
-
48
-
49
-
50
-
51
-
52
-
53
-
54
-
55
-
56
-
57
-
58
-
59
-
60
-
61
-
62
-
63
-
64
-
65
-
66
-
67
-
68
-
69
-
70
-
71
-
72
-
73
-
74
-
75
-
76
-
77
-
78
-
79
-
80
-
81
-
82
-
83
-
84
-
85
-
86
-
87
-
88
-
89
-
90
-
91
-
92
-
93
-
94
-
95
-
96
-
97
-
98
-
99
-
100
-
101
-
102
-
103
-
104
-
105
-
106
-
107
-
108
-
109
-
110
-
111
-
112
-
113
-
114
-
115
-
116
-
117
-
118
-
119
-
120
-
121
-
122
-
123
-
124
-
125
-
126
-
127
-
128
-
129
-
130
-
131
-
132
-
133
-
134
-
135
-
136
-
137
-
138
-
139
-
140
-
141
-
142
-
143
-
144
-
145
-
146
-
147
-
148
-
149
-
150
-
151
-
152
-
153
-
154
-
155
-
156
-
157
-
158
-
159
-
160
-
161
-
162
-
163
-
164
-
165
-
166
-
167
-
168
-
169
-
170
-
171
-
172
-
173
-
174
-
175
-
176
-
177
-
178
-
179
-
180
-
181
-
182
-
183
-
184
-
185
-
186
-
187
-
188
-
189
-
190
-
191
-
192
-
193
-
194
-
195
-
196
-
197
-
198
-
199
-
200
-
201
-
202
-
203
-
204
-
205
-
206
-
207
-
208
-
209
-
210
-
211
-
212
-
213
-
214
-
215
-
 216
216 -
 217
217 -
 218
218 -
 219
219 -
 220
220 -
 221
221 -
 222
222 -
 223
223 -
 224
224 -
 225
225 -
 226
226 -
 227
227 -
 228
228 -
 229
229 -
 230
230 -
 231
231 -
 232
232 -
 233
233 -
 234
234 -
 235
235 -
 236
236 -
237
-
238
-
239
-
240
-
241
-
242
-
243
-
244
-
245
-
246
-
247
-
248
-
249
-
250
-
251
-
252
-
253
-
254
-
255
-
256
-
257
-
258
-
259
-
260
-
261
-
262
-
263
-
264
-
265
-
266
-
267
-
268
-
269
-
270
-
271
-
272
-
273
-
274
-
275
-
276
-
277
-
278
-
279
-
280
-
281
-
282
-
283
-
284
-
285
-
286
-
287
-
288
-
289
-
290
-
291
-
292
-
293
-
294
-
295
-
296
-
297
-
298
-
299
-
300
-
301
-
302
-
303
-
304
-
305
-
306
-
307
-
308
-
309
-
310
-
311
-
312
-
313
-
314
-
315
-
316
-
317
-
318
-
319
-
320
-
321
-
322
-
323
-
324
-
325
-
326
-
327
-
328
-
329
-
330
 |
 |

221 Freddie Mac
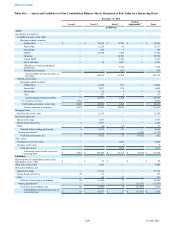
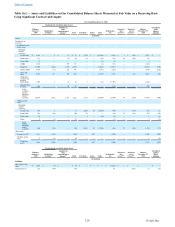
Assets on Our Consolidated Balance Sheets Measured at Fair Value on a Non-Recurring Basis
We may be required, from time to time, to measure certain assets at fair value on a non-recurring basis after our initial
recognition. These adjustments usually result from the application of lower-of-cost-or-fair-value accounting or measurement of
impairment based on the fair value of the underlying collateral. These assets include impaired held-for-investment single-
family and multifamily mortgage loans and REO, net.
The table below presents assets measured on our consolidated balance sheets at fair value on a non-recurring basis at
December 31, 2014 and 2013, respectively.
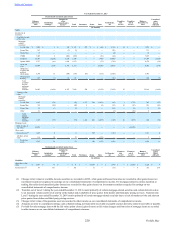
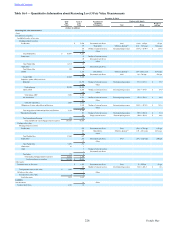
Table 16.3 — Assets on Our Consolidated Balance Sheets Measured at Fair Value on a Non-Recurring Basis
December 31,
2014 2013
Level 1 Level 2 Level 3 Total Level 1 Level 2 Level 3 Total
(in millions)
Assets measured at fair value
on a non-recurring basis:
Mortgage loans(1) $ — $ 80 $ 8,962 $ 9,042 $ — $ — $ 515 $ 515
REO, net(2) — — 1,665 1,665 — — 1,837 1,837
Total assets measured at fair value
on a non-recurring basis $ — $ 80 $ 10,627 $ 10,707 $ — $ — $ 2,352 $ 2,352
(1) Includes impaired single-family and multifamily mortgage loans that are classified as held-for-investment and have a related valuation allowance based
on the fair value of the underlying collateral and held-for-sale multifamily mortgage loans where the fair value is below cost.
(2) Represents the fair value of foreclosed properties that were measured at fair value subsequent to their initial classification as REO, net. The carrying
amount of REO, net was written down to fair value of $1.7 billion, less estimated costs to sell of $109 million (or approximately $1.6 billion) at
December 31, 2014. The carrying amount of REO, net was written down to fair value of $1.8 billion, less estimated costs to sell of $118 million (or
approximately $1.7 billion) at December 31, 2013.
Valuation Processes and Controls Over Fair Value Measurement
We designed our control processes so that our fair value measurements are appropriate and reliable, that they are based on
observable inputs where possible, and that our valuation approaches are consistently applied and the assumptions and inputs are
reasonable. Our control processes provide a framework for segregation of duties and oversight of our fair value methodologies,
techniques, validation procedures, and results.
Groups within our Finance division, independent of our business functions, execute and validate the valuation processes
and are responsible for determining the fair values of the majority of our financial assets and liabilities. In determining fair
value, we consider the credit risk of our counterparties in estimating the fair values of our assets and our own credit risk in
estimating the fair values of our liabilities. The fair values determined by our Finance division are further verified by an
independent group within our Enterprise Risk Management (ERM) division.
The validation procedures performed by ERM are intended to ensure that the prices we receive from third parties are
consistent with our observations of market activity, and that fair value measurements developed using internal data reflect the
assumptions that a market participant would use in pricing our assets and liabilities. These validation procedures include
performing a monthly independent verification of fair value measurements through independent modeling, analytics, and
comparisons to other market source data, if available. Where applicable, prices are back-tested by comparing actual settlement
prices to our fair value measurements. Analytical procedures include automated checks consisting of prior-period variance
analysis, comparisons of actual prices to internally calculated expected prices based on observable market changes, analysis of
changes in pricing ranges, relative value comparisons, and comparisons using modeled yields. Thresholds are set for each
product category by ERM to identify exceptions that require further analysis. If a price is outside of our established thresholds,
we perform additional validation procedures, including supplemental analytics and/or follow up discussions with the third-party
provider. If we are unable to validate the reasonableness of a given price, we ultimately do not use that price for fair value
measurements in our consolidated financial statements. These reviews are risk-based, cover all product categories, and are
executed before we finalize the prices used in preparing our fair value measurements for our financial statements.
In addition to performing the validation procedures noted above, ERM provides independent risk governance over all
valuation processes by establishing and maintaining a corporate-wide valuation framework and control policy. ERM also
independently reviews key judgments, methodologies, and valuation techniques to ensure compliance with established policies.
Our Valuation & Finance Model Committee (“Valuation Committee”), which includes representation from our business
areas, ERM, and Finance divisions, provides senior management’s governance over valuation processes, methodologies,
controls and fair value measurements. Identified exceptions are reviewed and resolved through the verification process and
reviewed at the Valuation Committee.
Where models are employed to assist in the measurement and verification of fair values, changes made to those models
during the period are reviewed and approved according to the corporate model change governance process, with all material
Table of Contents