Mattel 2015 Annual Report Download - page 25
Download and view the complete annual report
Please find page 25 of the 2015 Mattel annual report below. You can navigate through the pages in the report by either clicking on the pages listed below, or by using the keyword search tool below to find specific information within the annual report.-
 1
1 -
2
-
3
-
4
-
5
-
6
-
7
-
8
-
9
-
10
-
11
-
12
-
13
-
14
-
 15
15 -
 16
16 -
 17
17 -
 18
18 -
 19
19 -
 20
20 -
 21
21 -
 22
22 -
 23
23 -
 24
24 -
 25
25 -
 26
26 -
 27
27 -
 28
28 -
 29
29 -
 30
30 -
 31
31 -
 32
32 -
 33
33 -
 34
34 -
 35
35 -
36
-
37
-
38
-
39
-
40
-
41
-
42
-
43
-
44
-
45
-
46
-
47
-
48
-
49
-
50
-
51
-
52
-
53
-
54
-
55
-
56
-
57
-
58
-
59
-
60
-
61
-
62
-
63
-
64
-
65
-
66
-
67
-
68
-
69
-
70
-
71
-
72
-
73
-
74
-
75
-
76
-
77
-
78
-
79
-
80
-
81
-
82
-
83
-
84
-
85
-
86
-
87
-
88
-
89
-
90
-
91
-
92
-
93
-
94
-
95
-
96
-
97
-
98
-
99
-
100
-
101
-
102
-
103
-
104
-
105
-
106
-
107
-
108
-
109
-
110
-
111
-
112
-
113
-
114
-
115
 |
 |

21
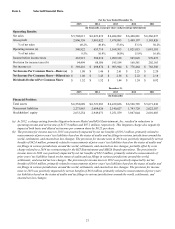
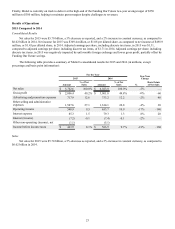
Item 6. Selected Financial Data.
For the Year Ended December 31,
2015 2014 2013 2012 2011
(In thousands, except per share and percentage information)
Operating Results:
Net sales $ 5,702,613 $ 6,023,819 $ 6,484,892 $ 6,420,881 $ 6,266,037
Gross profit 2,806,358 3,001,022 3,478,883 3,409,197 3,145,826
% of net sales 49.2% 49.8% 53.6% 53.1% 50.2%
Operating income (a) 540,922 653,714 1,168,103 1,021,015 1,041,101
% of net sales 9.5% 10.9% 18.0% 15.9% 16.6%
Income before income taxes 463,915 586,910 1,099,128 945,045 970,673
Provision for income taxes (b) 94,499 88,036 195,184 168,581 202,165
Net income (a) $ 369,416 $ 498,874 $ 903,944 $ 776,464 $ 768,508
Net Income Per Common Share—Basic (a) $ 1.08 $ 1.46 $ 2.61 $ 2.25 $ 2.20
Net Income Per Common Share—Diluted (a) $ 1.08 $ 1.45 $ 2.58 $ 2.22 $ 2.18
Dividends Declared Per Common Share $ 1.52 $ 1.52 $ 1.44 $ 1.24 $ 0.92
December 31,
2015 2014 2013 2012 2011
(In thousands)
Financial Position:
Total assets $ 6,552,689 $ 6,721,983 $ 6,439,626 $ 6,526,785 $ 5,671,638
Noncurrent liabilities 2,273,863 2,684,026 2,140,627 1,743,729 2,022,107
Stockholders’ equity 2,633,254 2,949,071 3,251,559 3,067,044 2,610,603
(a) In 2012, a charge arising from the litigation between Mattel and MGA Entertainment, Inc. resulted in reductions to
operating income and net income of $137.8 million and $87.1 million, respectively. This litigation charge also negatively
impacted both basic and diluted net income per common share by $0.25 per share.
(b) The provision for income taxes in 2015 was positively impacted by net tax benefits of $19.1 million, primarily related to
reassessments of prior years' tax liabilities based on the status of audits and tax filings in various jurisdictions around the
world, settlements, and enacted tax law changes. The provision for income taxes in 2014 was positively impacted by net tax
benefits of $42.6 million, primarily related to reassessments of prior years’ tax liabilities based on the status of audits and
tax filings in various jurisdictions around the world, settlements, and enacted tax law changes, partially offset by a tax
charge related to a 2014 tax restructuring for the HIT Entertainment and MEGA Brands operations. The provision for
income taxes in 2013 was positively impacted by net tax benefits of $32.2 million, primarily related to reassessments of
prior years’ tax liabilities based on the status of audits and tax filings in various jurisdictions around the world,
settlements, and enacted tax law changes. The provision for income taxes in 2012 was positively impacted by net tax
benefits of $16.0 million, primarily related to reassessments of prior years’ tax liabilities based on the status of audits and
tax filings in various jurisdictions around the world, settlements, and enacted tax law changes. The provision for income
taxes in 2011 was positively impacted by net tax benefits of $6.8 million, primarily related to reassessments of prior years’
tax liabilities based on the status of audits and tax filings in various jurisdictions around the world, settlements, and
enacted tax law changes.