Mattel 2015 Annual Report Download - page 96
Download and view the complete annual report
Please find page 96 of the 2015 Mattel annual report below. You can navigate through the pages in the report by either clicking on the pages listed below, or by using the keyword search tool below to find specific information within the annual report.-
 1
1 -
2
-
3
-
4
-
5
-
6
-
7
-
8
-
9
-
10
-
11
-
12
-
13
-
14
-
15
-
16
-
17
-
18
-
19
-
20
-
21
-
22
-
23
-
24
-
25
-
26
-
27
-
28
-
29
-
30
-
31
-
32
-
33
-
34
-
35
-
36
-
37
-
38
-
39
-
40
-
41
-
42
-
43
-
44
-
45
-
46
-
47
-
48
-
49
-
50
-
51
-
52
-
53
-
54
-
55
-
56
-
57
-
58
-
59
-
60
-
61
-
62
-
63
-
64
-
65
-
66
-
67
-
68
-
69
-
70
-
71
-
72
-
73
-
74
-
75
-
76
-
77
-
78
-
79
-
80
-
81
-
82
-
83
-
84
-
85
-
 86
86 -
 87
87 -
 88
88 -
 89
89 -
 90
90 -
 91
91 -
 92
92 -
 93
93 -
 94
94 -
 95
95 -
 96
96 -
 97
97 -
 98
98 -
 99
99 -
 100
100 -
 101
101 -
 102
102 -
 103
103 -
 104
104 -
 105
105 -
 106
106 -
107
-
108
-
109
-
110
-
111
-
112
-
113
-
114
-
115
 |
 |
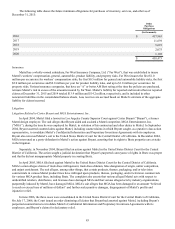
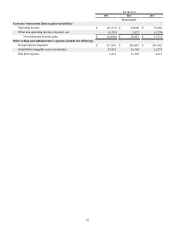
92
For the Year
2015 2014 2013
(In thousands)
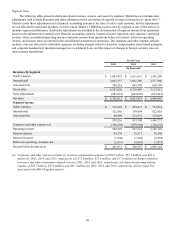
Currency transaction (losses) gains included in:
Operating income $(25,715) $ 44,060 $ 38,842
Other non-operating income (expense), net (8,291) 2,827 (1,270)
Net transaction (losses) gains $(34,006) $ 46,887 $ 37,572
Other selling and administrative expenses include the following:
Design and development $ 217,816 $ 209,467 $ 201,942
Identifiable intangible asset amortization 27,923 36,704 12,575
Bad debt expense 5,813 11,507 4,471