Mattel 2015 Annual Report Download - page 70
Download and view the complete annual report
Please find page 70 of the 2015 Mattel annual report below. You can navigate through the pages in the report by either clicking on the pages listed below, or by using the keyword search tool below to find specific information within the annual report.-
 1
1 -
2
-
3
-
4
-
5
-
6
-
7
-
8
-
9
-
10
-
11
-
12
-
13
-
14
-
15
-
16
-
17
-
18
-
19
-
20
-
21
-
22
-
23
-
24
-
25
-
26
-
27
-
28
-
29
-
30
-
31
-
32
-
33
-
34
-
35
-
36
-
37
-
38
-
39
-
40
-
41
-
42
-
43
-
44
-
45
-
46
-
47
-
48
-
49
-
50
-
51
-
52
-
53
-
54
-
55
-
56
-
57
-
58
-
59
-
 60
60 -
 61
61 -
 62
62 -
 63
63 -
 64
64 -
 65
65 -
 66
66 -
 67
67 -
 68
68 -
 69
69 -
 70
70 -
 71
71 -
 72
72 -
 73
73 -
 74
74 -
 75
75 -
 76
76 -
 77
77 -
 78
78 -
 79
79 -
 80
80 -
81
-
82
-
83
-
84
-
85
-
86
-
87
-
88
-
89
-
90
-
91
-
92
-
93
-
94
-
95
-
96
-
97
-
98
-
99
-
100
-
101
-
102
-
103
-
104
-
105
-
106
-
107
-
108
-
109
-
110
-
111
-
112
-
113
-
114
-
115
 |
 |

66
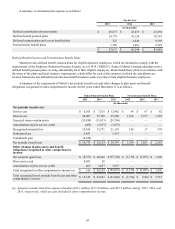
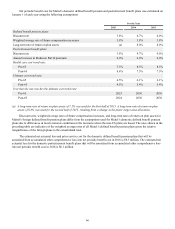
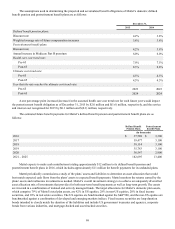
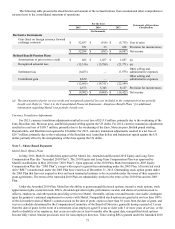
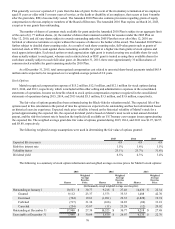
Net periodic benefit cost for Mattel’s domestic defined benefit pension and postretirement benefit plans was calculated on
January 1 of each year using the following assumptions:
For the Year
2015 2014 2013
Defined benefit pension plans:
Discount rate 3.8% 4.7% 4.0%
Weighted average rate of future compensation increases 3.8% 3.8% 3.8%
Long-term rate of return on plan assets (a) 8.0% 8.0%
Postretirement benefit plans:
Discount rate 3.8% 4.7% 4.0%
Annual increase in Medicare Part B premium 6.0% 6.0% 6.0%
Health care cost trend rate:
Pre-65 7.5% 8.5% 8.5%
Post-65 8.8% 7.5% 7.5%
Ultimate cost trend rate:
Pre-65 4.5% 6.1% 6.1%
Post-65 4.5% 5.4% 5.4%
Year that the rate reaches the ultimate cost trend rate:
Pre-65 2023 2030 2030
Post-65 2024 2030 2030
(a) A long-term rate of return on plan assets of 7.5% was used for the first half of 2015. A long-term rate of return on plan
assets of 6.8% was used for the second half of 2015, resulting from a change in the plans' target asset allocation.
Discount rates, weighted average rates of future compensation increases, and long-term rates of return on plan assets for
Mattel’s foreign defined benefit pension plans differ from the assumptions used for Mattel’s domestic defined benefit pension
plans due to differences in local economic conditions in the locations where the non-US plans are based. The rates shown in the
preceding table are indicative of the weighted average rates of all Mattel’s defined benefit pension plans given the relative
insignificance of the foreign plans to the consolidated total.
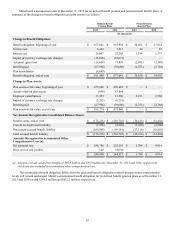
The estimated net actuarial loss and prior service cost for the domestic defined benefit pension plans that will be
amortized from accumulated other comprehensive loss into net periodic benefit cost in 2016 is $9.3 million. The estimated net
actuarial loss for the domestic postretirement benefit plans that will be amortized from accumulated other comprehensive loss
into net periodic benefit cost in 2016 is $0.1 million.