Mattel 2015 Annual Report Download - page 27
Download and view the complete annual report
Please find page 27 of the 2015 Mattel annual report below. You can navigate through the pages in the report by either clicking on the pages listed below, or by using the keyword search tool below to find specific information within the annual report.-
 1
1 -
2
-
3
-
4
-
5
-
6
-
7
-
8
-
9
-
10
-
11
-
12
-
13
-
14
-
15
-
16
-
 17
17 -
 18
18 -
 19
19 -
 20
20 -
 21
21 -
 22
22 -
 23
23 -
 24
24 -
 25
25 -
 26
26 -
 27
27 -
 28
28 -
 29
29 -
 30
30 -
 31
31 -
 32
32 -
 33
33 -
 34
34 -
 35
35 -
 36
36 -
 37
37 -
38
-
39
-
40
-
41
-
42
-
43
-
44
-
45
-
46
-
47
-
48
-
49
-
50
-
51
-
52
-
53
-
54
-
55
-
56
-
57
-
58
-
59
-
60
-
61
-
62
-
63
-
64
-
65
-
66
-
67
-
68
-
69
-
70
-
71
-
72
-
73
-
74
-
75
-
76
-
77
-
78
-
79
-
80
-
81
-
82
-
83
-
84
-
85
-
86
-
87
-
88
-
89
-
90
-
91
-
92
-
93
-
94
-
95
-
96
-
97
-
98
-
99
-
100
-
101
-
102
-
103
-
104
-
105
-
106
-
107
-
108
-
109
-
110
-
111
-
112
-
113
-
114
-
115
 |
 |

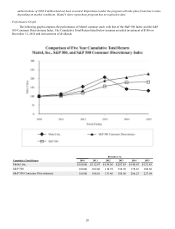
23
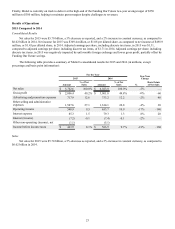
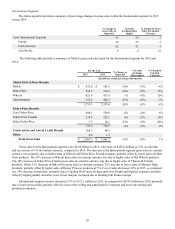
Finally, Mattel is currently on track to deliver at the high-end of the Funding Our Future two-year savings target of $250
million to $300 million, helping to maintain gross margins despite challenges to revenues.
Results of Operations
2015 Compared to 2014
Consolidated Results
Net sales for 2015 were $5.70 billion, a 5% decrease as reported, and a 2% increase in constant currency, as compared to
$6.02 billion in 2014. Net income for 2015 was $369.4 million, or $1.08 per diluted share, as compared to net income of $498.9
million, or $1.45 per diluted share, in 2014. Adjusted earnings per share, including discrete tax items, in 2015 was $1.31,
compared to adjusted earnings per share, including discrete tax items, of $1.71 in 2014. Adjusted earnings per share, including
discrete tax items, in 2015 was negatively impacted by unfavorable foreign exchange and lower gross profit, partially offset by
Funding Our Future savings.
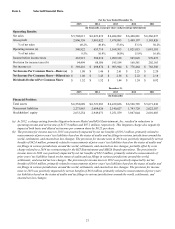
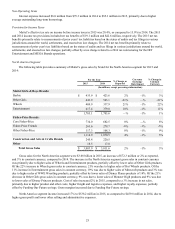
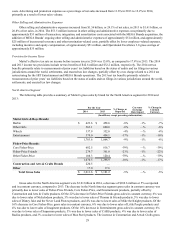
The following table provides a summary of Mattel’s consolidated results for 2015 and 2014 (in millions, except
percentage and basis point information):
For the Year Year/Year
Change2015 2014
Amount
% of Net
Sales Amount
% of Net
Sales %
Basis Points
of Net Sales
Net sales $ 5,702.6 100.0% $ 6,023.8 100.0% -5%—
Gross profit $ 2,806.4 49.2% $ 3,001.0 49.8% -6% –60
Advertising and promotion expenses 717.9 12.6 733.2 12.2 -2%40
Other selling and administrative
expenses 1,547.6 27.1 1,614.1 26.8 -4%30
Operating income 540.9 9.5 653.7 10.9 -17% –140
Interest expense 85.3 1.5 79.3 1.3 8% 20
Interest (income) (7.2) -0.1 (7.4)-0.1 -2%—
Other non-operating (income), net (1.1) (5.1)
Income before income taxes $ 463.9 8.1% $ 586.9 9.7% -21% –160
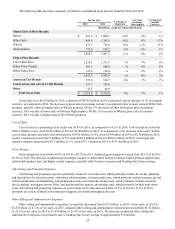
Sales
Net sales for 2015 were $5.70 billion, a 5% decrease as reported, and a 2% increase in constant currency, as compared to
$6.02 billion in 2014.