Mattel 2015 Annual Report Download - page 30
Download and view the complete annual report
Please find page 30 of the 2015 Mattel annual report below. You can navigate through the pages in the report by either clicking on the pages listed below, or by using the keyword search tool below to find specific information within the annual report.-
 1
1 -
2
-
3
-
4
-
5
-
6
-
7
-
8
-
9
-
10
-
11
-
12
-
13
-
14
-
15
-
16
-
17
-
18
-
19
-
 20
20 -
 21
21 -
 22
22 -
 23
23 -
 24
24 -
 25
25 -
 26
26 -
 27
27 -
 28
28 -
 29
29 -
 30
30 -
 31
31 -
 32
32 -
 33
33 -
 34
34 -
 35
35 -
 36
36 -
 37
37 -
 38
38 -
 39
39 -
 40
40 -
41
-
42
-
43
-
44
-
45
-
46
-
47
-
48
-
49
-
50
-
51
-
52
-
53
-
54
-
55
-
56
-
57
-
58
-
59
-
60
-
61
-
62
-
63
-
64
-
65
-
66
-
67
-
68
-
69
-
70
-
71
-
72
-
73
-
74
-
75
-
76
-
77
-
78
-
79
-
80
-
81
-
82
-
83
-
84
-
85
-
86
-
87
-
88
-
89
-
90
-
91
-
92
-
93
-
94
-
95
-
96
-
97
-
98
-
99
-
100
-
101
-
102
-
103
-
104
-
105
-
106
-
107
-
108
-
109
-
110
-
111
-
112
-
113
-
114
-
115
 |
 |
26
International Segment
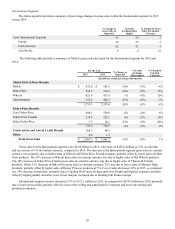
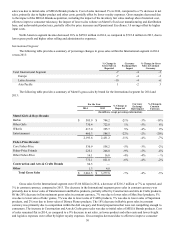
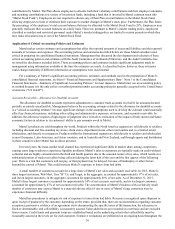
The following table provides a summary of percentage changes in gross sales within the International segment in 2015
versus 2014:
% Change in
Gross Sales as
Reported
Currency
Exchange Rate
Impact
% Change in Gross
Sales in Constant
Currency
Total International Segment -15 -16 1
Europe -18 -15 -3
Latin America -22 -21 -1
Asia Pacific 8-8 16
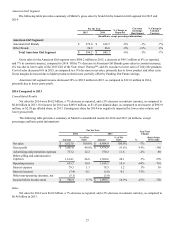
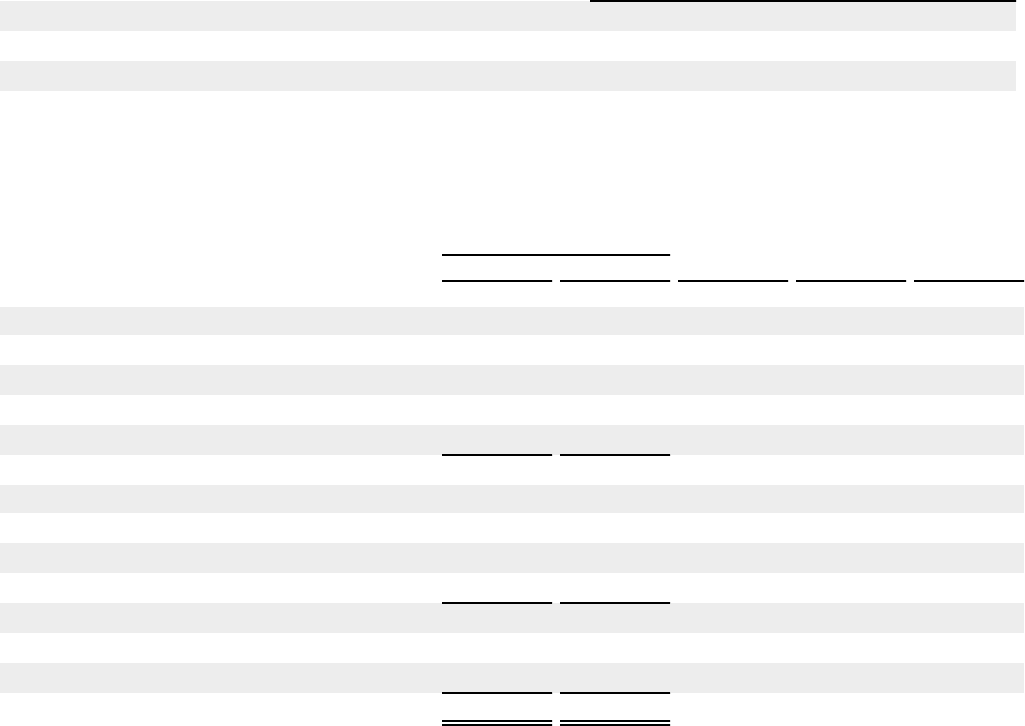
The following table provides a summary of Mattel’s gross sales by brand for the International segment for 2015 and
2014:
For the Year % Change as
Reported
Currency
Exchange
Rate Impact
% Change in
Constant
Currency
2015 2014
(In millions, except percentage information)
Mattel Girls & Boys Brands:
Barbie $ 472.0 $ 585.9 -19%-15%-4%
Other Girls 510.5 730.4 -30%-15%-15%
Wheels 421.4 417.0 1% -19% 20%
Entertainment 355.2 460.3 -23%-16%-7%
1,759.1 2,193.6 -20%-16%-4%
Fisher-Price Brands:
Core Fisher-Price 490.1 530.9 -8%-14%6%
Fisher-Price Friends 239.5 225.1 6% -12% 18%
Other Fisher-Price 7.7 16.1 -52%-12%-40%
737.3 772.1 -4%-13%9%
Construction and Arts & Crafts Brands 106.3 94.5
Other 0.8 1.3
Total Gross Sales $ 2,603.5 $ 3,061.5 -15%-16%1%
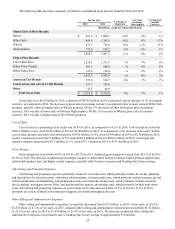
Gross sales for the International segment were $2.60 billion in 2015, a decrease of $458.0 million or 15% as reported,
and an increase of 1% in constant currency, compared to 2014. The increase in the International segment gross sales in constant
currency was primarily due to higher sales of Wheels and Fisher-Price Friends products, partially offset by lower sales of Other
Girls products. The 20% increase in Wheels gross sales in constant currency was due to higher sales of Hot Wheels products.
The 18% increase in Fisher-Price Friends gross sales in constant currency was due to higher sales of Thomas & Friends
products. Of the 15% decrease in Other Girls gross sales in constant currency, 22% was due to lower sales of Monster High
products, partially offset by higher sales of Disney Princess products of 5%. Cost of sales decreased 18% in 2015, as compared
to a 14% decrease in net sales, primarily due to Funding Our Future savings and lower freight and logistics expenses, partially
offset by higher product and other costs. Gross margins increased due to Funding Our Future savings.
International segment income decreased 11% to $321.1 million in 2015, as compared to $359.9 million in 2014, primarily
due to lower gross profit, partially offset by lower other selling and administrative expenses and lower advertising and
promotion expenses.