Mattel 2015 Annual Report Download - page 72
Download and view the complete annual report
Please find page 72 of the 2015 Mattel annual report below. You can navigate through the pages in the report by either clicking on the pages listed below, or by using the keyword search tool below to find specific information within the annual report.-
 1
1 -
2
-
3
-
4
-
5
-
6
-
7
-
8
-
9
-
10
-
11
-
12
-
13
-
14
-
15
-
16
-
17
-
18
-
19
-
20
-
21
-
22
-
23
-
24
-
25
-
26
-
27
-
28
-
29
-
30
-
31
-
32
-
33
-
34
-
35
-
36
-
37
-
38
-
39
-
40
-
41
-
42
-
43
-
44
-
45
-
46
-
47
-
48
-
49
-
50
-
51
-
52
-
53
-
54
-
55
-
56
-
57
-
58
-
59
-
60
-
61
-
 62
62 -
 63
63 -
 64
64 -
 65
65 -
 66
66 -
 67
67 -
 68
68 -
 69
69 -
 70
70 -
 71
71 -
 72
72 -
 73
73 -
 74
74 -
 75
75 -
 76
76 -
 77
77 -
 78
78 -
 79
79 -
 80
80 -
 81
81 -
 82
82 -
83
-
84
-
85
-
86
-
87
-
88
-
89
-
90
-
91
-
92
-
93
-
94
-
95
-
96
-
97
-
98
-
99
-
100
-
101
-
102
-
103
-
104
-
105
-
106
-
107
-
108
-
109
-
110
-
111
-
112
-
113
-
114
-
115
 |
 |

68
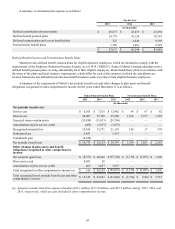
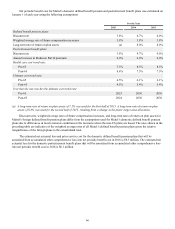
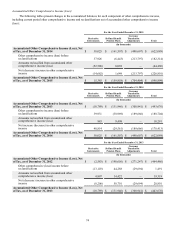
The assumptions used in determining the projected and accumulated benefit obligations of Mattel’s domestic defined
benefit pension and postretirement benefit plans are as follows:
December 31,
2015 2014
Defined benefit pension plans:
Discount rate 4.2% 3.8%
Weighted average rate of future compensation increases 3.8% 3.8%
Postretirement benefit plans:
Discount rate 4.2% 3.8%
Annual increase in Medicare Part B premium 6.0% 6.0%
Health care cost trend rate:
Pre-65 7.0% 7.5%
Post-65 8.3% 8.8%
Ultimate cost trend rate:
Pre-65 4.5% 4.5%
Post-65 4.5% 4.5%
Year that the rate reaches the ultimate cost trend rate:
Pre-65 2023 2023
Post-65 2024 2024
A one percentage point increase/(decrease) in the assumed health care cost trend rate for each future year would impact
the postretirement benefit obligation as of December 31, 2015 by $2.0 million and $(1.6) million, respectively, and the service
and interest cost recognized for 2015 by $0.1 million and $(0.1) million, respectively.
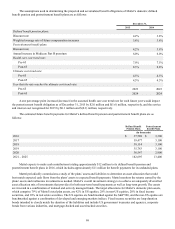
The estimated future benefit payments for Mattel’s defined benefit pension and postretirement benefit plans are as
follows:
Defined Benefit
Pension Plans
Postretirement
Benefit Plans
(In thousands)
2016 $ 37,588 $ 3,300
2017 39,477 3,100
2018 38,114 3,100
2019 35,783 3,100
2020 36,547 2,900
2021 – 2025 182,695 13,400
Mattel expects to make cash contributions totaling approximately $12 million to its defined benefit pension and
postretirement benefit plans in 2016, which includes approximately $11 million for benefit payments for its unfunded plans.
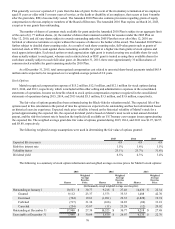
Mattel periodically commissions a study of the plans’ assets and liabilities to determine an asset allocation that would
best match expected cash flows from the plans’ assets to expected benefit payments. Mattel monitors the returns earned by the
plans’ assets and reallocates investments as needed. Mattel’s overall investment strategy is to achieve an adequately diversified
asset allocation mix of investments that provides for both near-term benefit payments as well as long-term growth. The assets
are invested in a combination of indexed and actively managed funds. The target allocations for Mattel’s domestic plan assets,
which comprise 79% of Mattel’s total plan assets, are 42% in US equities, 28% in non-US equities, 20% in fixed income
securities, and 10% in real estate securities. The US equities are benchmarked against the S&P 500, and the non-US equities are
benchmarked against a combination of developed and emerging markets indices. Fixed income securities are long-duration
bonds intended to closely match the duration of the liabilities and include US government treasuries and agencies, corporate
bonds from various industries, and mortgage-backed and asset-backed securities.